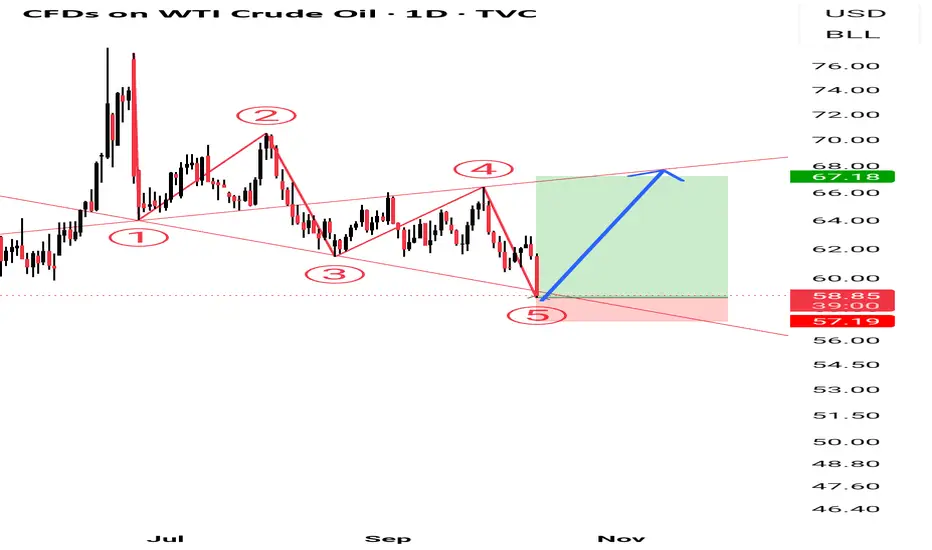
US Oil wolfwaveMy idea us oil wolfwave pattren use small trade with SL big profit
If hit SL buy again trend line up side break same SL
WTI trade ideas
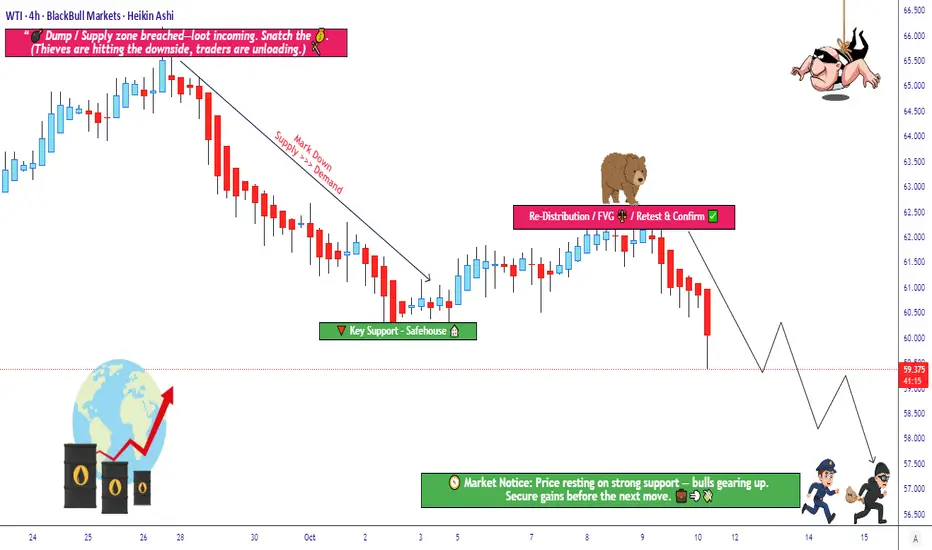
Is Crude Oil Setting Up for a Major Bearish Reversal?🛢️ XTI/USD “WTI” – Bearish Redistribution Zone Incoming (Thief Strategy Inside)
📉 Setup Overview
Market: XTI/USD (WTI crude oil)
Bias: Bearish confirmed — we’re looking for re-distribution / supply pressure to take control
Trade Type: Swing / Day Trade hybrid
🎯 Entry Plan (Thief-Layer Strategy)
I use a layering / multiple limit order approach (aka “Thief Strategy”). You may use any price level as entry, but here’s my preferred ladder:
Sell Limit @ 61.500
Sell Limit @ 61.000
Sell Limit @ 60.500
Sell Limit @ 60.000
Sell Limit @ 59.500
(You may extend more layers if you like)
You don’t need to hit all layers — just get partial fills, ride the move downward.
🚫 Stop Loss
Thief’s SL: 62.500
⚠️ Note to Thief OG’s: I’m not forcing you to follow my SL. You choose what works. Make money, take money — at your own risk.
🎯 Target
We see police barricade as a strong support zone + oversold trap possibility.
So primary target: 57.000
⚠️ Note to Thief OG’s: Don’t blindly hold to my TP. If price gives you your gains early, escape with your money — don’t wait for perfection.
🔍 Related Pairs & Correlations
AMEX:USO or USOIL (oil ETFs / indices) – real-world crude correlation
$BRENT/USD – watch for strength or weakness divergence
AMEX:XOP / AMEX:OIH (oil & gas sector indices) – sentiment in energy names
Key point: if Brent weakens while WTI breaks down, it reinforces the bias.
📌 Key Technical Notes
We’re waiting for ** redistribution / supply zone** to hold — a retest or failure bounce is ideal setup.
Oversold conditions + a “trap” candle (fake breakout) strengthen the move.
Use layering to average in, not “all-in” at once.
Be ready for whipsaws around support zones; partial exits can help.
✨ “If you find value in my analysis, a 👍 and 🚀 boost is much appreciated — it helps me share more setups with the community!”
Disclaimer: This is Thief-style trading strategy just for fun. I am not giving financial advice. Trade at your own decision and risk.
#WTI #CrudeOil #XTIUSD #EnergyTrading #OilStrategy #Layering #SwingTrade #DayTrade #BearishBias #ThiefStrategy
Oil Crash | $33Price action making another leg down after retesting the breakout ~($68) from the descending triangle
Would like to see a move to $56 then another retest towards the breakout before any major selling.
Overall target for long term swing $33.

Update of yesterday’s analysisAs we mentioned yesterday, $60 per barrel didn’t make sense under the current conditions, and there was a high probability that oil would open with a positive gap — which indeed happened. It’s now struggling with the $62 resistance level.
If it manages to break this resistance, it will effectively re-enter the long-term range it was previously in, increasing the chances of the price reaching the top of that range. ✅
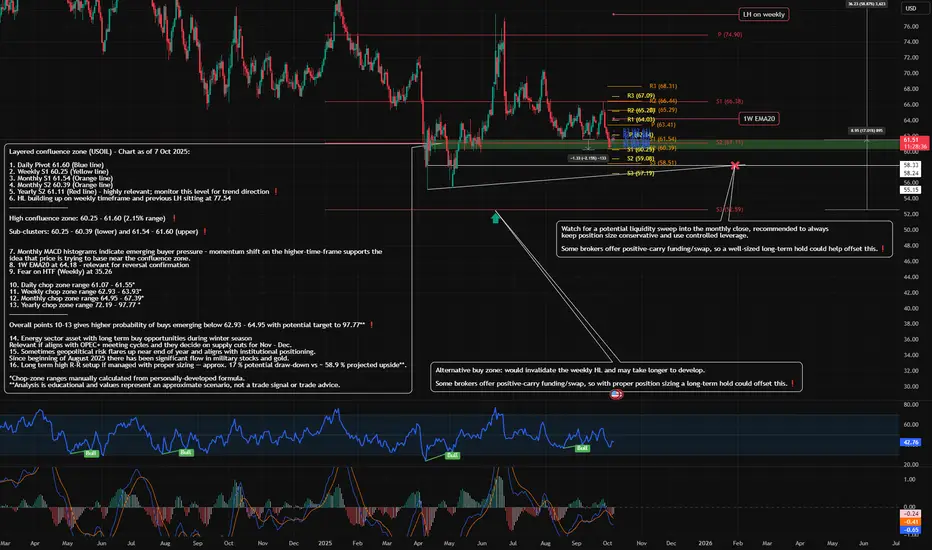
USDWTI – HTF Multi-Confluence Analysis Near 1Y Low | OCT 2025We are approaching a multi-layer confluence support on oil that aligns several HTF analysis factors and potential seasonal and geopolitical considerations .
This area represents a robust multi-confluence support zone — likely near a yearly low — offering a compelling blend of technical support and long-term positioning.
For reference, the USDWTI (ICE) has been used as the feed provides a reliable, continuous spot-price series for modern WTI crude — ideal for EMAs, pivots and near-term technical structure . Many retail-broker CFD feeds cover only limited history, which can be insufficient for HTF analysis .
Full USDWTI chart analysis:
🔎 Key Technical Levels on the Confluence Zone
1. Daily Pivot: 61.60
2. Weekly S1: 60.25
3. Monthly S1: 61.54
4. Monthly S2: 60.39
5. Yearly S2: 61.11
Primary Confluence Zone: 60.25 - 61.60 (≈ 2.15 % range)
• Sub-clusters: 60.25 - 60.39 (lower) and 61.54 - 61.60 (upper)
____________
📊 Momentum & Structure
6. Monthly MACD histogram turning upward → early buyer pressure on HTF
7. 1W EMA-20 ≈ 64.18 – needs to be reclaimed for any sustained long-term reversal
8. Fear on weekly timeframe at 35.46
9. Daily chop zone: 61.07 - 61.55*
10. Weekly chop zone: 62.93 - 63.93*
11. Monthly chop zone: 64.95 - 67.39*
12. Yearly chop zone: 72.19 - 97.77*
____________
Seasonal / Macro Notes
13. Energy sector often benefits from Q4–winter demand (heating-fuel season).
OPEC+ meeting cycle in Nov–Dec: any production cuts would reinforce technical support.
14. Geopolitical risk often rises year-end; since Aug 2025 , capital has rotated into gold and defence stocks , reflecting risk-hedge positioning.
15. Long term high R-R setup if managed with proper sizing — approx. 17 % potential draw-down vs ~ 58.9 % projected upside **.
____________
💡 Context
Crude typically shows mild seasonal firming from Oct → early winter on heating demand and OPEC policy, though this can be offset by high inventories, a mild winter, or weak macro growth.
The content in this analysis highlights a high-probability zone (60.25 - 61.60) where multiple confluences align, useful for observation and study .
This is not a buy or sell signal. These observations are for market-study purposes only and should not be interpreted as trade instructions.
____________
⚠️ Risk Note:
It is recommended not to overleverage your positions. Overexposure is the main killer of portfolios. Position sizing directly impacts mental clarity: excessive size can cloud judgment and trigger emotional reactions , while appropriate sizing supports composure and disciplined execution. It is better to collect steady breadcrumbs than to risk giving away your capital.
Trading risk can be managed but never eliminated.
❗️ Disclaimer:
This content is provided for educational purposes only . It does not constitute financial, legal, tax, or investment advice. The author does not provide trading signals, portfolio management, or any services regulated by the Financial Conduct Authority.
___________
*Chop-zone ranges manually calculated from personally-developed formula.
**Analysis is educational and values represent an approximate scenario, not a trade signal or trade advice.
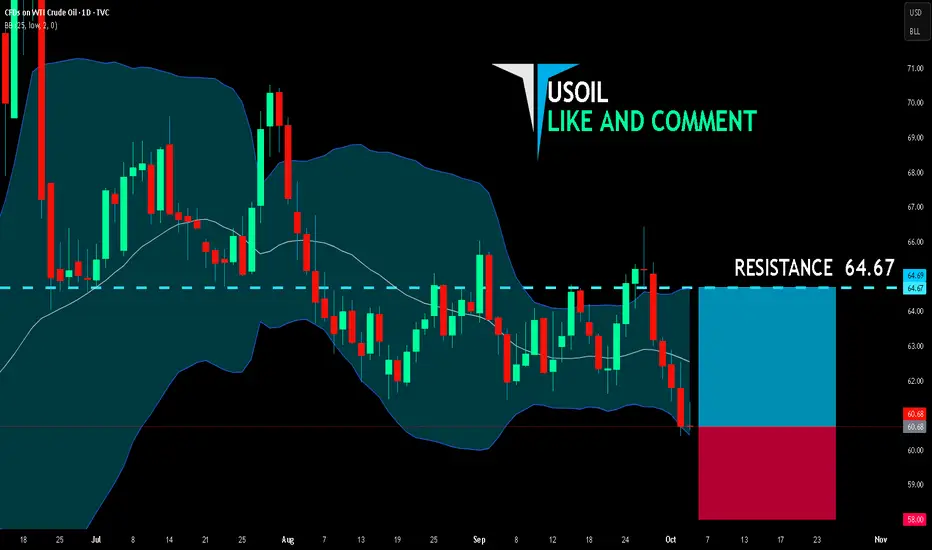
USOIL LONG FROM SUPPORT
USOIL SIGNAL
Trade Direction: long
Entry Level: 60.68
Target Level: 64.67
Stop Loss: 58.00
RISK PROFILE
Risk level: medium
Suggested risk: 1%
Timeframe: 1D
Disclosure: I am part of Trade Nation's Influencer program and receive a monthly fee for using their TradingView charts in my analysis.
✅LIKE AND COMMENT MY IDEAS✅
USOIL: Waiting for a reaction at strong supportTo better understand my current outlook on USOIL, please refer to my previous higher-timeframe and fundamental analyses.
* Trend: assessed using at least three trend indicators, with market structure as the primary guide.
** Weak or Reversal Signals: Assessed based on one of our criteria for trend reversal signals.
*** Support/Resistance: Selected from multiple factors – static (Swing High, Swing Low, etc.), dynamic (EMA, MA, etc.), psychological (Fibonacci, RSI, etc.) – and determined based on the trader’s discretion.
**** Our advice takes into account all factors, including both fundamental and technical analysis. It is not intended as a profit target. We hope it can serve as a reference to help you trade more effectively. This advice is for informational purposes only and we assume no responsibility for any trading results based on it.
Please like and comment below to support our traders. Your reactions will motivate us to do more analysis in the future 🙏✨
George Vann @ ZuperView
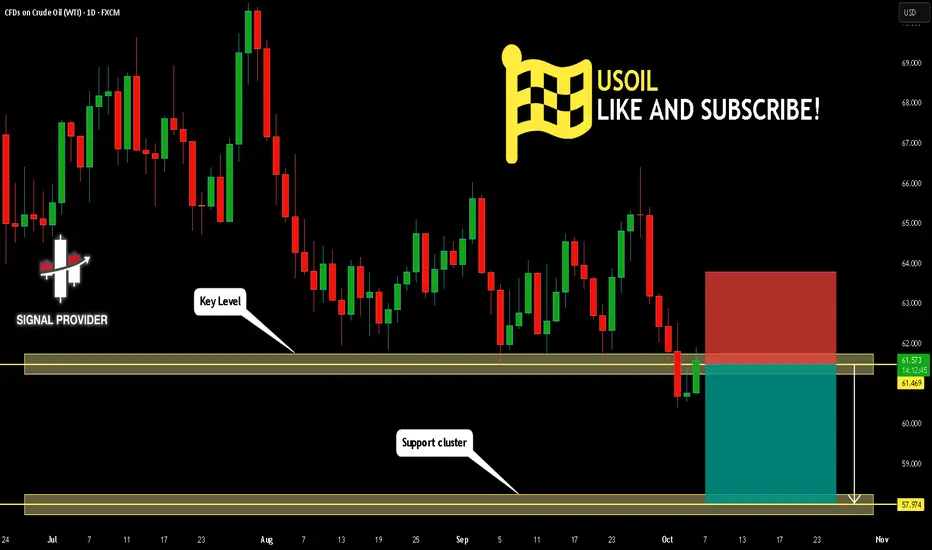
USOIL Will Move Lower! Sell!
Here is our detailed technical review for USOIL.
Time Frame: 1D
Current Trend: Bearish
Sentiment: Overbought (based on 7-period RSI)
Forecast: Bearish
The market is on a crucial zone of supply 61.469.
The above-mentioned technicals clearly indicate the dominance of sellers on the market. I recommend shorting the instrument, aiming at 57.974 level.
P.S
Overbought describes a period of time where there has been a significant and consistent upward move in price over a period of time without much pullback.
Like and subscribe and comment my ideas if you enjoy them!
CRUDE OIL Will Keep Falling! Sell!
Hello,Traders!
CRUDE OIL retested the horizontal supply area cleanly and is now forming a pullback, confirming Smart Money’s intent to continue distribution. Liquidity above recent highs is likely absorbed, with price expected to target 60.10$ to rebalance inefficiency and continue bearish flow.Time Frame 3H.
Sell!
Comment and subscribe to help us grow!
Check out other forecasts below too!
Disclosure: I am part of Trade Nation's Influencer program and receive a monthly fee for using their TradingView charts in my analysis.

CRUDE OIL REBOUND AHEAD|LONG|
✅WTI OIL has tapped into the demand level after a sharp decline, showing signs of accumulation. A reaction from this discount area could drive price higher toward 61.10$, where liquidity above minor highs is resting. Time Frame 2H.
LONG🚀
✅Like and subscribe to never miss a new idea!✅

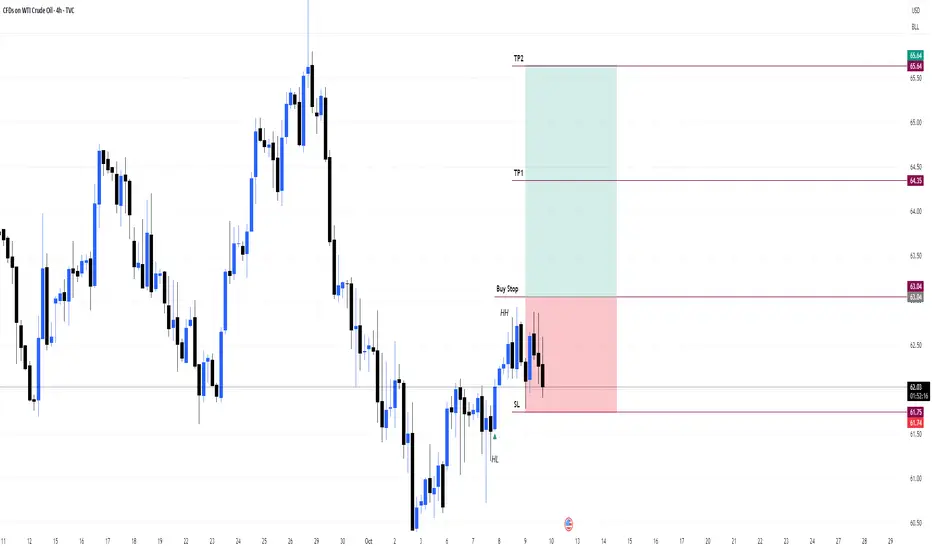
USOILPrice recently formed a Higher High, confirming bullish momentum.
Currently, price is pulling back and forming a Higher Low, maintaining the uptrend structure.
📈 Buy Stop placed above the previous Higher High, anticipating a breakout continuation.
🛑 Stop Loss set just below the Higher Low, where price previously reversed.
🎯 Risk to Reward: 1:2, aiming for a favorable reward relative to the risk.
Structure: Bullish (HH + HL)
Entry Type: Breakout Entry
Confirmation: Structure + Buy Stop Strategy
SL: Below HL | TP: 2x Risk
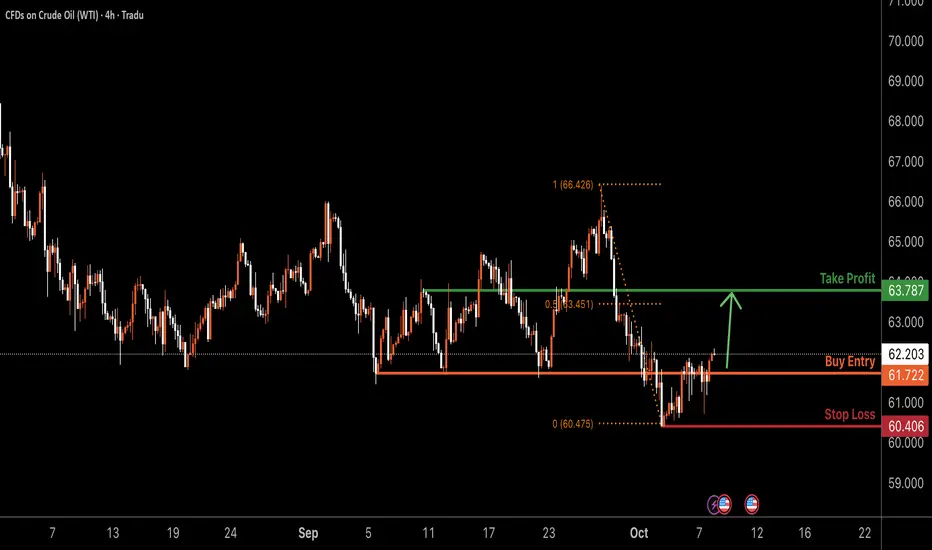
USOIL H4 | Bullish Reversal Forming at Key Support LevelUSOIL is reacting off the buy entry, which is an overlap support and could potentially rise from this level to the take profit.
Buy entry is at 61.72, which his an overlap support.
Stop loss is at 60.40, which is a pullback support.
Take profit is at 63.78, which is a pullback resistance that is slightly above the 50% Fibonacci retracement.
High Risk Investment Warning
Trading Forex/CFDs on margin carries a high level of risk and may not be suitable for all investors. Leverage can work against you.
Stratos Markets Limited (tradu.com ):
CFDs are complex instruments and come with a high risk of losing money rapidly due to leverage. 65% of retail investor accounts lose money when trading CFDs with this provider. You should consider whether you understand how CFDs work and whether you can afford to take the high risk of losing your money.
Stratos Europe Ltd (tradu.com ):
CFDs are complex instruments and come with a high risk of losing money rapidly due to leverage. 66% of retail investor accounts lose money when trading CFDs with this provider. You should consider whether you understand how CFDs work and whether you can afford to take the high risk of losing your money.
Stratos Global LLC (tradu.com ):
Losses can exceed deposits.
Please be advised that the information presented on TradingView is provided to Tradu (‘Company’, ‘we’) by a third-party provider (‘TFA Global Pte Ltd’). Please be reminded that you are solely responsible for the trading decisions on your account. There is a very high degree of risk involved in trading. Any information and/or content is intended entirely for research, educational and informational purposes only and does not constitute investment or consultation advice or investment strategy. The information is not tailored to the investment needs of any specific person and therefore does not involve a consideration of any of the investment objectives, financial situation or needs of any viewer that may receive it. Kindly also note that past performance is not a reliable indicator of future results. Actual results may differ materially from those anticipated in forward-looking or past performance statements. We assume no liability as to the accuracy or completeness of any of the information and/or content provided herein and the Company cannot be held responsible for any omission, mistake nor for any loss or damage including without limitation to any loss of profit which may arise from reliance on any information supplied by TFA Global Pte Ltd.
The speaker(s) is neither an employee, agent nor representative of Tradu and is therefore acting independently. The opinions given are their own, constitute general market commentary, and do not constitute the opinion or advice of Tradu or any form of personal or investment advice. Tradu neither endorses nor guarantees offerings of third-party speakers, nor is Tradu responsible for the content, veracity or opinions of third-party speakers, presenters or participants.
US OILHI GUYS
US OIL has a manipulation around area of interest. as soon as it hit 6am to 11am london session people were liquidated. i mentioned this on the btc usd chart. idea.
HS area is mostly manipulated . always wait for a candle close for entries. we are still in london session so buys are now. there is divergence on rsi and a price pattern in min chart

US OIL HI GUYS,
correction on technical analysis
update on us oil, the market has shifted to H1, H2 STRUCTURE, this means we close or trail our profits. anyway we cant hold for the incoming HS H1, H2.
TOMORROW IS FRIDAY , ITS MID NIGHT SHIT TODAY IS FRIDAY.
Anyway the picture above shows a new trend, will be waiting for London session for buy entries around 6 am, to 11,am.
structure has not changed just a shift in time frame. so yes we always expect anything as we move.

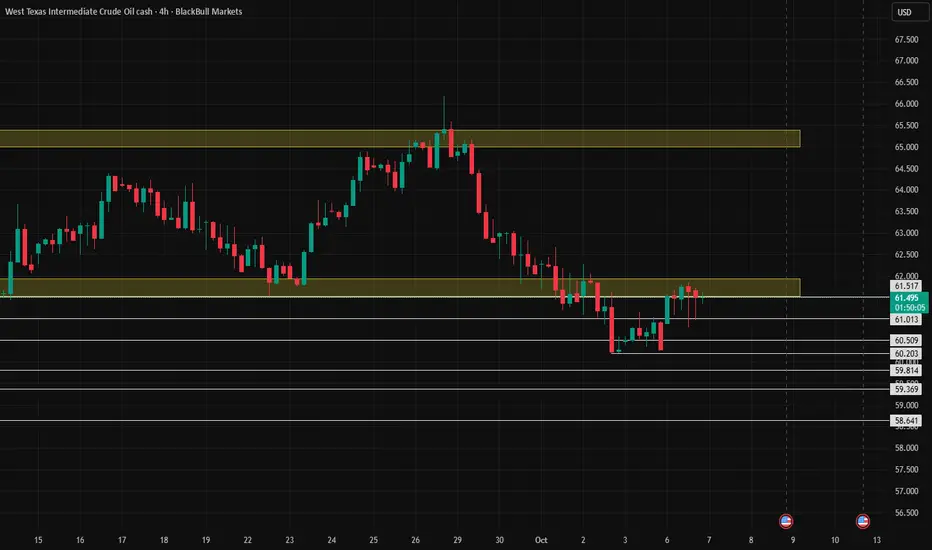
WTI Trade Plan 06/10/2025Dear Traders,
📊 WTI Crude Oil (USOIL) Technical Analysis
After a fake breakout below the range, the price has returned inside the box, indicating a potential liquidity grab and preparation for a bullish move.
Key Technical Levels:
Major support: 60.8 – 61.2
As long as the price holds above this support zone, a move toward 64.0 and eventually 66.0 is likely.
A short-term pullback may occur around 64.0 before continuation to the upside.
🟢 Bullish Scenario (more likely):
If the current support holds, next targets are 64 → 66.
🔴 Bearish Scenario:
If the price breaks below 60.8 and stabilizes there, we could see another drop toward 59.5 – 59.0.
🛢️ Conclusion:
Oil is currently sitting at an attractive area for potential long setups with controlled risk, but waiting for confirmation — such as a breakout above 62.5 — is recommended for safer entries.
Regards,
Alireza!

us oilHI GUYS,
NOTE. we are still selling as the market is trying to catch up on the the RT DAILY STRUCTURE. This i posted earlier last month, lets trade with a vision of the future to ease or smoother any trade of interest be it buy or sell we are aware of market direction

Oil analysisThe drop in oil prices is quite interesting, especially given the current instability in the Middle East and the escalating war between Russia and Ukraine. I expect oil to open with a bullish gap, since $60 per barrel simply doesn’t make sense under these conditions. ✅

USOIL made Bullish Harami Pattern LongUSOIL made bullish Harami pattern and price likely will go this type of pattern is sign of reverse signal . Let us see ow it plays out.

Do crude oil bulls still have a chance?With the easing of tensions in the Middle East, the declining geopolitical risk premium in the region, which sources approximately one-third of global crude oil exports, has put short-term pressure on crude oil. The US government shutdown, now in its tenth day, has heightened market concerns and dampened energy consumption demand.
From the daily chart, oil prices have fallen below the lower limit of their range, with the medium-term objective trend downward. The MACD indicator's fast and slow lines are below zero, indicating a dominant bearish trend. A second attempt to break above the 62.3 level failed in the short-term 1H trend, and the price again fell back below resistance. The moving averages are in a bearish pattern, with the MACD indicator's fast and slow lines crossing downward, indicating strong bearish momentum.
The trading strategy is primarily to buy on rebounds, supplemented by buying on dips. Focus on resistance at 61.0-62.0 in the short term. Focus on support at 58.5-57.5 in the short term.
For investors currently holding short positions or unsure how to trade, please like and follow my channel. I will provide exclusive trading services for members.

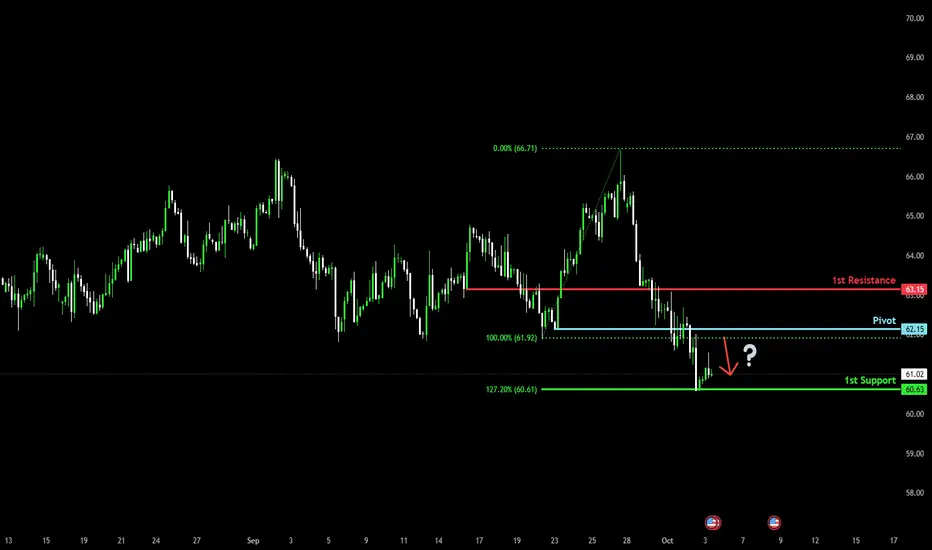
Bearish continuation?WTI Oil (XTI/USD) is rising towards the pivot, which is a pullback resistance, and could drop to the 1st support.
Pivot: 62.15
1st Support: 60.63
1st Resistance: 63.15
Disclaimer:
The above opinions given constitute general market commentary, and do not constitute the opinion or advice of IC Markets or any form of personal or investment advice.
Any opinions, news, research, analyses, prices, other information, or links to third-party sites contained on this website are provided on an "as-is" basis, are intended only to be informative, is not an advice nor a recommendation, nor research, or a record of our trading prices, or an offer of, or solicitation for a transaction in any financial instrument and thus should not be treated as such. The information provided does not involve any specific investment objectives, financial situation and needs of any specific person who may receive it. Please be aware, that past performance is not a reliable indicator of future performance and/or results. Past Performance or Forward-looking scenarios based upon the reasonable beliefs of the third-party provider are not a guarantee of future performance. Actual results may differ materially from those anticipated in forward-looking or past performance statements. IC Markets makes no representation or warranty and assumes no liability as to the accuracy or completeness of the information provided, nor any loss arising from any investment based on a recommendation, forecast or any information supplied by any third-party.
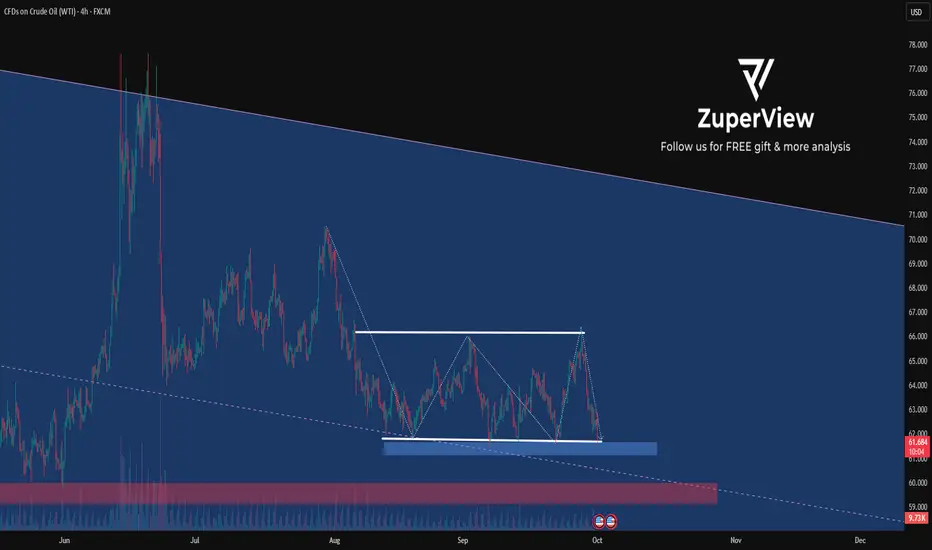
WTI Crude Oil
As shown in my previous analysis (pinned below this post), we shorted oil from the range high.
Now price has reached the range low, where two key buy levels are marked on the chart ✅.
🔹 If these levels break, the opposite scenario still stands.
🔹 We’re not in OPEC, we don’t make political or war decisions, and we don’t give orders to the market.
🔹 We are traders, simply trying to profit from opportunities.
⚡️ Remember: being biased toward your analysis = blowing up your account and losing confidence.
🎯 Always follow the market, never fight it.

Crude oil review - DAILY- 06/10/2025Oil prices rose about 1% after OPEC+ announced a smaller-than-expected production increase for November, easing some supply concerns. The group will raise output by 137,000 barrels per day, matching October’s pace, as it tries to stabilize a weakening market. Internal divisions surfaced, with Russia favoring the modest hike to avoid price pressure, while Saudi Arabia reportedly pushed for a larger boost to regain market share faster. Analysts expect upcoming refinery maintenance in the Middle East and other regions to temporarily cap prices by freeing up more crude for export and reducing refinery demand. Still, weak demand expectations and the risk of oversupply are likely to limit further gains while seasonal slowdowns and underperforming macroeconomic data suggest the market is moving toward a phase of surplus.
On the technical side, crude oil price has declined last week and has almost reached the $60 price mark. Currently, it is testing the resistance of the 23.6% of the daily Fibonacci retracement level as well as the lower band of the sideways channel formation that has been in effect since early August. The Bollinger Bands are quite expanded, indicating that volatility has increased in the crude oil market, while the moving averages confirm the overall bearish trend. On the other hand, the Stochastic oscillator is in extreme oversold levels after the bearish correction, hinting that a bullish momentum may be building up, which could push the price to the upside in the upcoming sessions.
Disclaimer: The opinions in this article are personal to the writer and do not reflect those of Exness
