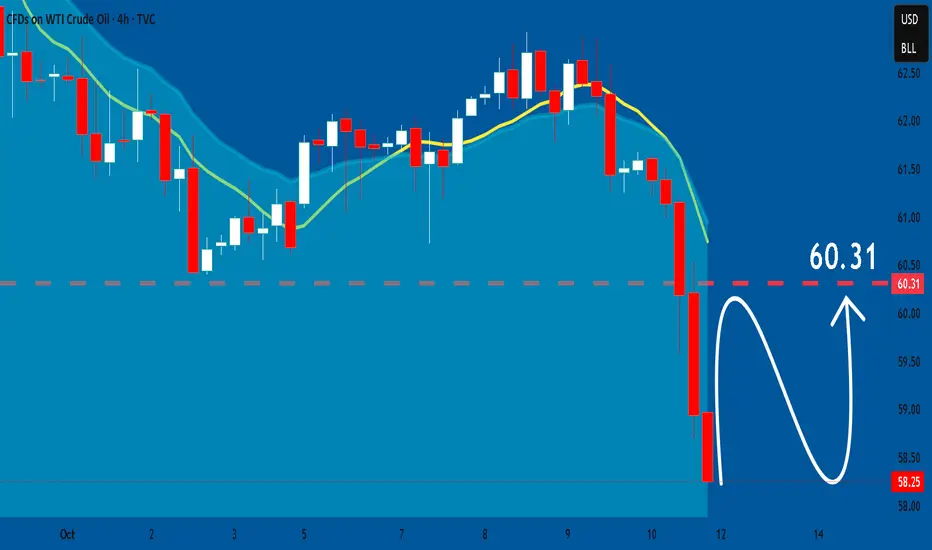
Crude oil opens a path to $60Crude oil is in play after testing the $65 technical resistnace, and reverting back to the downtrend.
Having shown a large distribution day, crude oil might reverse back to the downtrend with reaching a fair price of $60, which is a fair price pointed by eia.gov for Q4, 2025.
Yesterday's proposal of the US president Donald Trump about deescalation in Gaza was approved by Israeli prime minister Netanyahu. That is a move towards decreasing geopolitical tensions in the Middle East, though the situation may be far from the resolution.
Anyways, Crude oil futures have reacted with the decline, confirming weak sentiment and overall bearish context.
One may consider a trend-following trade with a potential target of $60.
Don't forget - this is just the idea, always do your own research and never forget to manage your risk!
WTI trade ideas

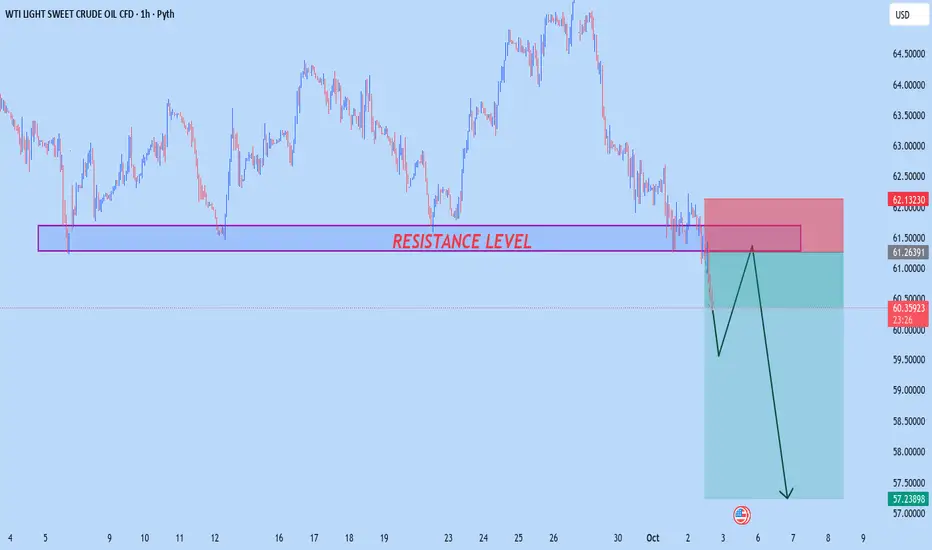
USOIL NEW OUTLOOK According to H1 analysis USOIL market break the support level and make it RESISTANCE LEVEL now market Running in selling pressure so it will be go more in sell so wait for opportunity we have chance to go sell from RESISTANCE
TRADE AT YOUR OWN RISK
REGARD ALBERT
USOIL Struggles to Hold Gains, Bearish Trend Intact
Current market sentiment is bearish.
USOIL is struggling to hold above resistance and leaning towards support.
USOIL is trading at $63.76, below the mid-Bollinger band → showing weak momentum.
Price failed to hold above $66–68 resistance zone and is now trending lower.
Price is leaning towards the lower band, suggesting bearish continuation risk.

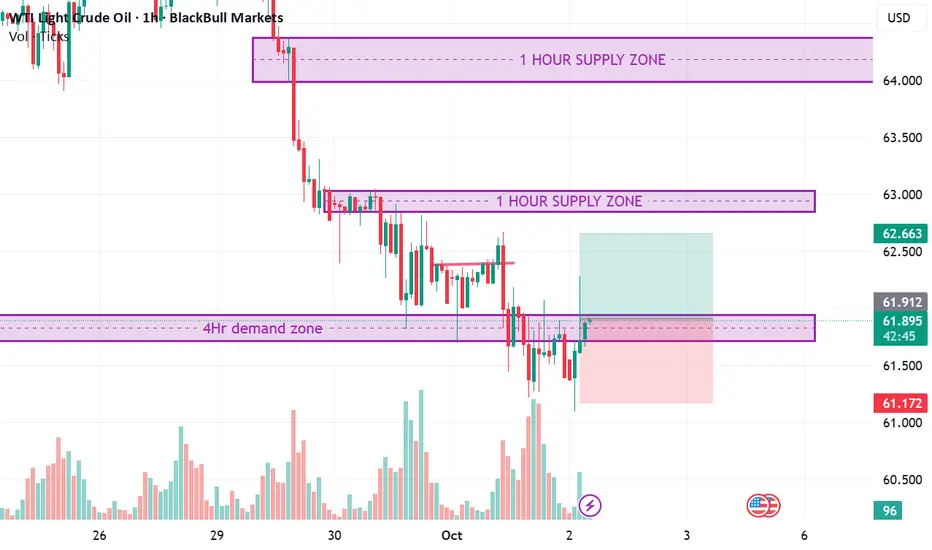
WTI RR 1:1 scalp. W bottomWTI RR 1:1 scalp. W bottom
Formation of a W bottom near an H4 demand zone area.
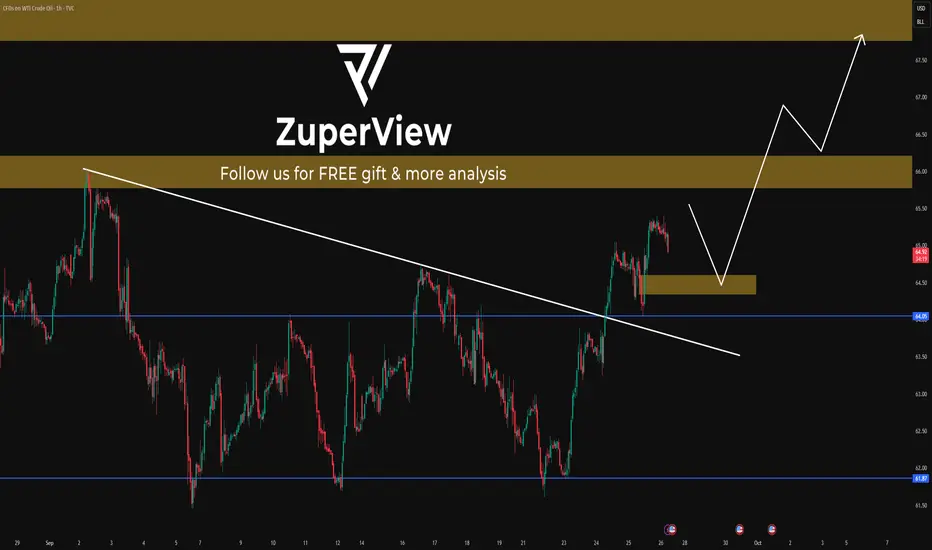
CRUDE OIL Will Grow! Buy!
Hello,Traders!
CRUDE OIL after sweeping liquidity from the horizontal demand area, price shows signs of rebalancing inefficiency. From an SMC perspective, buyers may drive the market toward the marked target zone. Time Frame 5H.
Buy!
Comment and subscribe to help us grow!
Check out other forecasts below too!
Disclosure: I am part of Trade Nation's Influencer program and receive a monthly fee for using their TradingView charts in my analysis.

USOIL: Waiting for resistance rejection & buying at support zonePlease refer to my previous higher-timeframe analyses to better follow my current outlook on USOIL.
* Trend: assessed using at least three trend indicators, with market structure as the primary guide.
** Weak or Reversal Signals: Assessed based on one of our criteria for trend reversal signals.
*** Support/Resistance: Selected from multiple factors – static (Swing High, Swing Low, etc.), dynamic (EMA, MA, etc.), psychological (Fibonacci, RSI, etc.) – and determined based on the trader’s discretion.
**** Our advice takes into account all factors, including both fundamental and technical analysis. It is not intended as a profit target. We hope it can serve as a reference to help you trade more effectively. This advice is for informational purposes only and we assume no responsibility for any trading results based on it.
Please like and comment below to support our traders. Your reactions will motivate us to do more analysis in the future 🙏✨
USOIL STRONG DEMAND AREA|LONG|
✅WTI OIL price reacts at demand level, showing signs of absorption with liquidity grabs. ICT model points to bullish orderflow aiming for the nearby target zone. Time Frame: 4H.
LONG🚀
✅Like and subscribe to never miss a new idea!✅

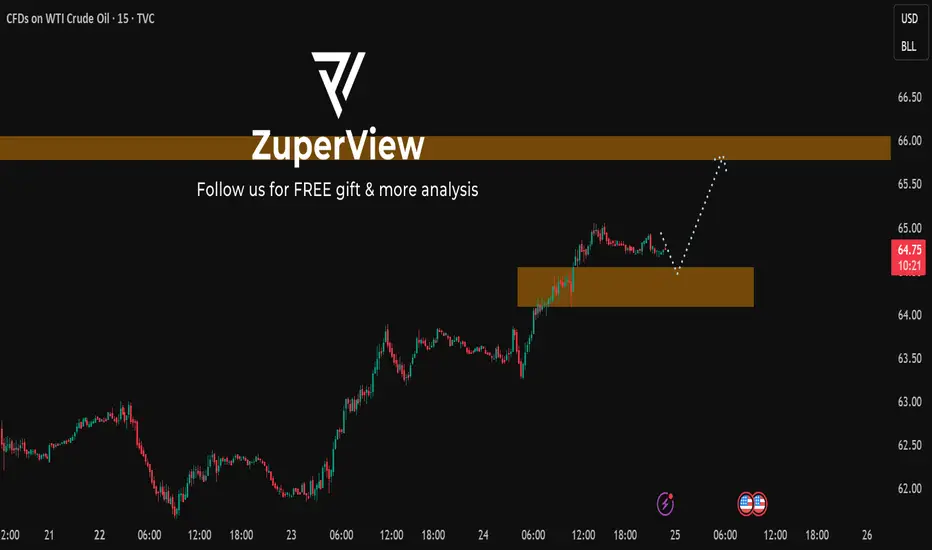
USOIL: Breaks $64.75 — Is a retest of $66 and higher level?This is my previous analysis — feel free to take a look for reference.
* Trend: assessed using at least three trend indicators, with market structure as the primary guide.
** Weak or Reversal Signals: Assessed based on one of our criteria for trend reversal signals.
*** Support/Resistance: Selected from multiple factors – static (Swing High, Swing Low, etc.), dynamic (EMA, MA, etc.), psychological (Fibonacci, RSI, etc.) – and determined based on the trader’s discretion.
**** Our advice takes into account all factors, including both fundamental and technical analysis. It is not intended as a profit target. We hope it can serve as a reference to help you trade more effectively. This advice is for informational purposes only and we assume no responsibility for any trading results based on it.
Please like and comment below to support our traders. Your reactions will motivate us to do more analysis in the future 🙏✨
USOIL: Range-bound setup with upside test before downside risk
* Trend: assessed using at least three trend indicators, with market structure as the primary guide.
** Weak or Reversal Signals: Assessed based on one of our criteria for trend reversal signals.
*** Support/Resistance: Selected from multiple factors – static (Swing High, Swing Low, etc.), dynamic (EMA, MA, etc.), psychological (Fibonacci, RSI, etc.) – and determined based on the trader’s discretion.
**** Our advice takes into account all factors, including both fundamental and technical analysis. It is not intended as a profit target. We hope it can serve as a reference to help you trade more effectively. This advice is for informational purposes only and we assume no responsibility for any trading results based on it.
Please like and comment below to support our traders. Your reactions will motivate us to do more analysis in the future 🙏✨
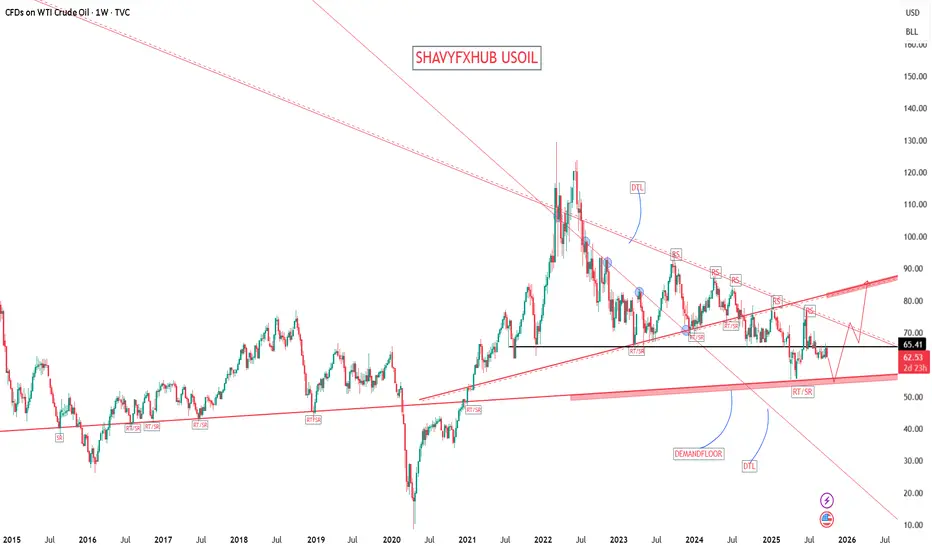
USOIL USOIL could still deep before the price rally, if we retest the floor at 54.58-55.52 then oil could swing into the descending trendline and a breakout will be communicated .
#usoil #oil
Renewed buy trigger on oilOil has been moving in this range for nearly 60 days and has now reached the bottom of the range. Based on the range strategy, the chart’s history, and the Middle East situation, it’s worth considering a long position here — it looks like a good setup. ✅

USOIL BULLS ARE STRONG HERE|LONG
USOIL SIGNAL
Trade Direction: long
Entry Level: 62.93
Target Level: 64.18
Stop Loss: 62.10
RISK PROFILE
Risk level: medium
Suggested risk: 1%
Timeframe: 4h
Disclosure: I am part of Trade Nation's Influencer program and receive a monthly fee for using their TradingView charts in my analysis.
✅LIKE AND COMMENT MY IDEAS✅

USOIL BEARS WILL DOMINATE THE MARKET|SHORT
USOIL SIGNAL
Trade Direction: short
Entry Level: 65.18
Target Level: 63.42
Stop Loss: 66.35
RISK PROFILE
Risk level: medium
Suggested risk: 1%
Timeframe: 9h
Disclosure: I am part of Trade Nation's Influencer program and receive a monthly fee for using their TradingView charts in my analysis.
✅LIKE AND COMMENT MY IDEAS✅

WTI Bearish Idea
As mentioned last evening , The fib will show small signs of pullback but since a regular candle has closed below fib support level 62.90 (38.20%) is strongly pulling price to 61.84 (14.60%) support which will play a major support. If this gets broken and the 4h candle closes below 61.84 level it will attract deeper pull to 61.19 and 60.66 which is the next support on the daily chart.

Crude Oil (WTI) Technical OutlookCrude Oil (WTI) has recently tested a critical resistance zone around $65, showing strong upside momentum after weeks of consolidation. The chart structure suggests a potential bullish breakout, with price action forming higher lows and pressing against a key supply level.
If WTI holds above $65, the next upside targets lie at:
$67.80 – intermediate resistance
$68.98 – major technical level aligned with previous supply
$70.50 – $71.00 – key psychological resistance and prior swing high
A short-term retest of $65 may act as confirmation before continuation toward the $70+ region. Failure to hold above $64.50 could invalidate the bullish scenario and open a move back toward $62.
This analysis highlights institutional order flow dynamics and key liquidity levels, indicating that crude oil may be setting up for a significant directional move. Traders should watch for clean breaks and retests at major support/resistance zones before positioning.
📌 Summary:
Bias: Bullish above $65
Targets: $67.80 → $68.98 → $70.50+
Risk: Breakdown below $64.50

WTI Crude Oil🔹 I’ve marked the key resistance zones.
🔹 If I see a reversal signal at any of these levels, I’ll go short.
🔹 The breakout scenario is always valid too—if a level breaks, I’ll take the trade in the direction of the market.
🚫 No bias towards numbers, levels, or analysis.
✨ The key is to flow with the market, not fight it. If you try to stand against it, the market won’t just take your money—it will crush your confidence too.
🎯 We’re only a small part of a bigger picture. Stay flexible, stay unbiased.


USOIL Trading Opportunity! SELL!
My dear friends,
My technical analysis for USOIL is below:
The market is trading on 65.18 pivot level.
Bias - Bearish
Technical Indicators: Both Super Trend & Pivot HL indicate a highly probable Bearish continuation.
Target - 64.22
About Used Indicators:
A pivot point is a technical analysis indicator, or calculations, used to determine the overall trend of the market over different time frames.
Disclosure: I am part of Trade Nation's Influencer program and receive a monthly fee for using their TradingView charts in my analysis.
———————————
WISH YOU ALL LUCK

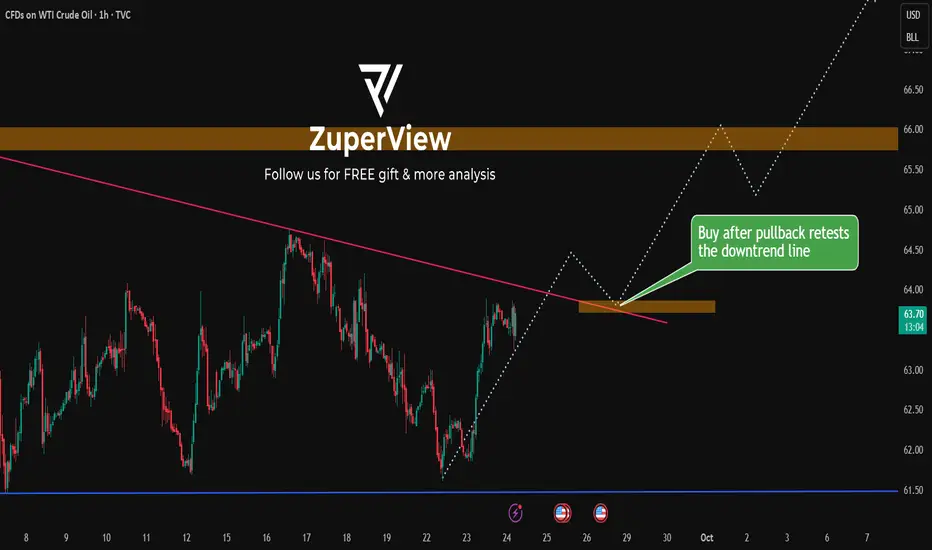
Crude Oil (WTI) Short Setup Bearish Reversal from Rising ChannelAsset: CFDs on Crude Oil (WTI)
Timeframe: 1 Hour (1H)
Pattern: Rising channel (ascending parallel channel)
Trade Type: Short (Sell) Setup
Risk/Reward: The trade is planned based on a channel breakdown, targeting a move down to the base of the move.
📊 Key Trade Levels
Type Price Level
Entry 6,709.7 – 6,711.0 (near upper channel resistance)
Stop Loss 6,762.0 – 6,762.3 (above recent highs)
Target 6,353.6 – 6,353.8 (near recent support)
🧠 Trade Rationale
Rising Channel Break: Price is currently within a rising channel, but recent candles show rejection at the upper boundary.
Fakeout Trap: There's a sketched projection suggesting a false breakout to the upside, followed by a sharp reversal into a short move.
Entry Zone: The trade is planned if price retests the upper zone (entry area), which aligns with the top of the channel.
Target Zone: The projected target is around the bottom of the channel or just below, implying a full retracement of the previous bullish leg.
Risk Management: Stop loss is placed slightly above the upper boundary to avoid getting stopped out by minor wicks.
📈 Technical Insights
Bearish Momentum Potential: If price fails to hold above the channel and re-enters with strong bearish volume, it supports a short entry.
Volume Analysis Needed: A confirmation with increasing volume on the breakdown would strengthen the setup.
Trend Reversal Signal: This setup may be hinting at a trend reversal or at least a significant pullback from the current upward trend.
✅ Conclusion
This is a high-probability short trade setup based on:
A break/retest of an ascending channel.
A potential false breakout trap.
Defined entry, stop loss, and take profit levels offering a solid risk/reward ratio.

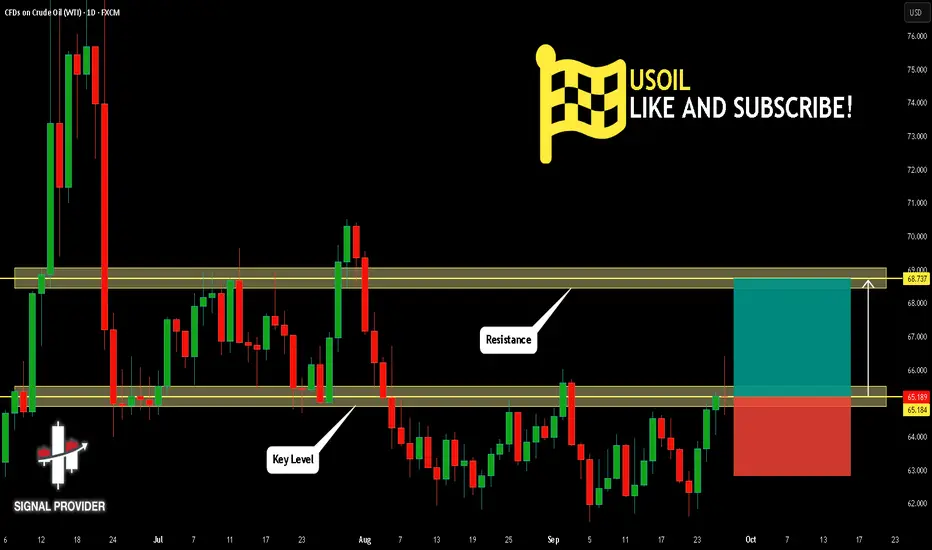
USOIL Is Bullish! Long!
Please, check our technical outlook for USOIL.
Time Frame: 1D
Current Trend: Bullish
Sentiment: Oversold (based on 7-period RSI)
Forecast: Bullish
The market is approaching a significant support area 65.184.
The underlined horizontal cluster clearly indicates a highly probable bullish movement with target 68.737 level.
P.S
Please, note that an oversold/overbought condition can last for a long time, and therefore being oversold/overbought doesn't mean a price rally will come soon, or at all.
Like and subscribe and comment my ideas if you enjoy them!
USOIL: Bullish Forecast & Outlook
The analysis of the USOIL chart clearly shows us that the pair is finally about to go up due to the rising pressure from the buyers.
❤️ Please, support our work with like & comment! ❤️
USOIL: Target Is Down! Short!
My dear friends,
Today we will analyse USOIL together☺️
The in-trend continuation seems likely as the current long-term trend appears to be strong, and price is holding below a key level of 58.752 So a bearish continuation seems plausible, targeting the next low. We should enter on confirmation, and place a stop-loss beyond the recent swing level.
❤️Sending you lots of Love and Hugs❤️
USOil Market Analysis📉 Core Market Drivers
The current weakness in oil prices is primarily weighed down by the combined impact of the following two factors:
1. Fading Geopolitical Risk Premium
Israel and Hamas have signed a ceasefire agreement, and Israel has begun withdrawing troops from the Gaza Strip. This development has largely erased the geopolitical risk premium that previously underpinned oil prices.
2. Loosening Supply-Demand Dynamics
OPEC+ recently agreed to raise production quotas, while oil output from non-OPEC+ producers remains stable—stoking growing concerns over a market supply surplus. The U.S. Energy Information Administration has released a bearish forecast, stating that the supply-demand imbalance will lead to a buildup of oil inventories.
💎 Trading Strategy Recommendations
sell@58.30
tp 57.50
