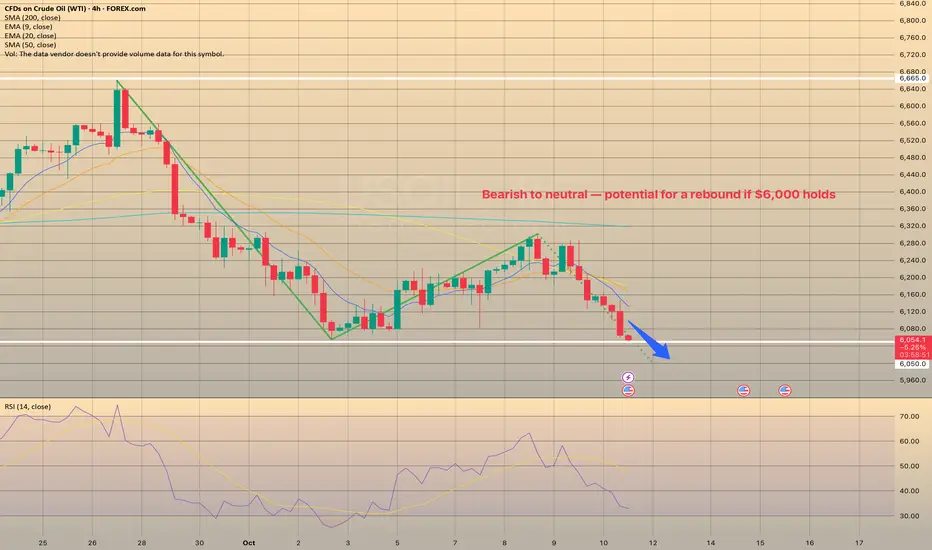
Oil Market: Bearish to neutral — potential for a rebound if $6,0Oil Market: Bearish to neutral — potential for a rebound if $6,000 holds
Crude and gasoline prices fell on Oct. 9 as market sentiment shifted amid rising supply expectations.
OPEC+ agreed to raise output by 137,000 bpd starting November, well below expectations of a 500,000 bpd hike. The group continues to unwind earlier cuts, aiming to restore 1.66 million bpd of production by year-end. OPEC’s September output rose 400,000 bpd to 29.05 million bpd, a 2.5-year high.
On Oct. 10 supply concerns eased after Israel accepted a U.S.-brokered cease-fire deal in Gaza, reducing geopolitical risk premiums. Still, new U.S. sanctions on Iran—targeting over 50 entities linked to oil and LPG trade—helped limit further losses.
Russian supply disruptions remain a supportive factor after drone attacks forced shutdowns at key refineries, while floating storage volumes fell 7% week-on-week to 82.8 million barrels, signaling tighter near-term supply.
Meanwhile, Iraq’s plan to resume Kurdish exports (up to 500,000 bpd) could weigh on prices, offsetting some of the geopolitical support.
EIA data showed U.S. crude inventories 4.5% below the 5-year average, with production up 0.9% w/w to 13.63 million bpd, near record highs. Active U.S. oil rigs slipped by two to 422, just above the four-year low.
Outlook:
Crude oil continues to display a bearish short-term structure, extending its recent downtrend after failing to sustain above the $6,300–$6,350 resistance zone. The price has now revisited the local support area around $6,050–$6,000, which has acted as a key pivot level in recent sessions.
ANZ Research expects near-term downside risks amid higher OPEC+ supply and weaker refinery demand, though low stockpiles outside China may cushion prices into 2026.
A clean rebound from $6,000 could trigger a short-covering move toward $6,200–$6,300.
WTI trade ideas
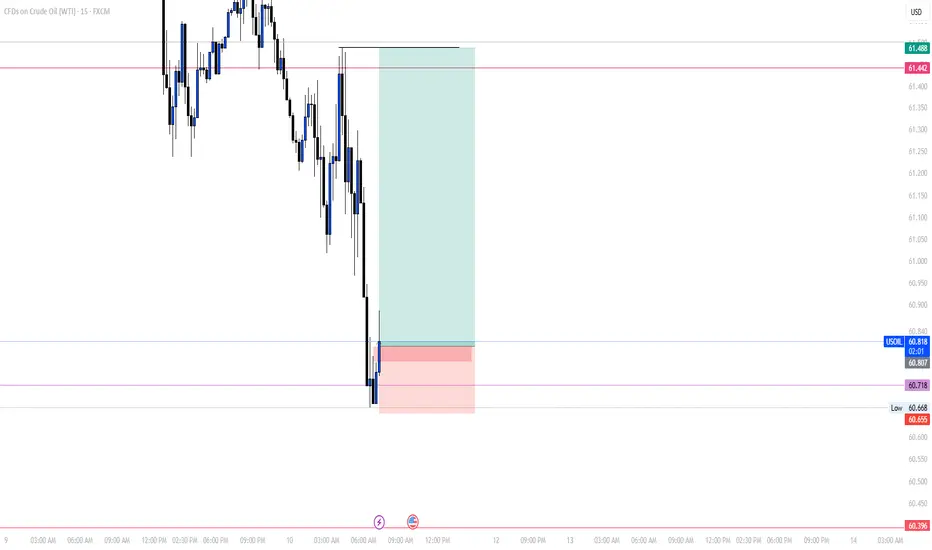
BUY USOILOur trade today on USOIL is bullish, you can buy following the same levles as mine.
We bought after that the market did a liquidity sweep and gave us a reversal.
Follow for more!
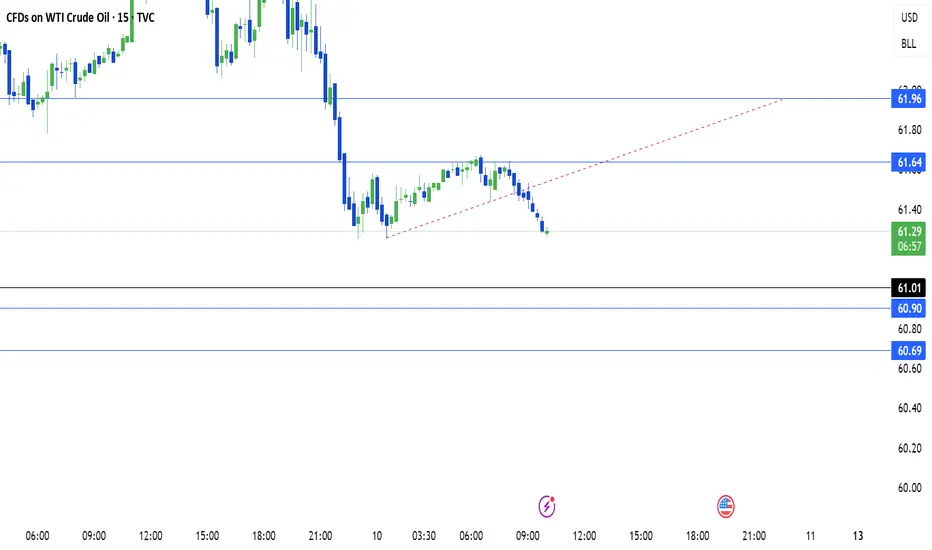
US OIL SUPPORT, RESISTANCE & TRENDLINE ANALYSISGo "SHORT" and likely to touch 61.01 / 60.90 and 60.69
Go "LONG" if it breaks the marked trendline and above 61.64 with immediate short-term target 61.96.
NOTE: My personal view is Bearish for the time being.

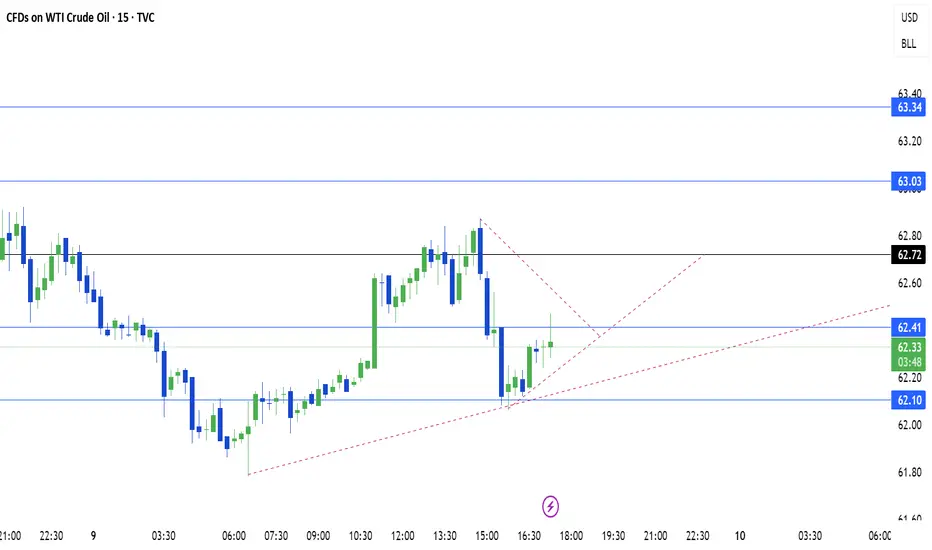
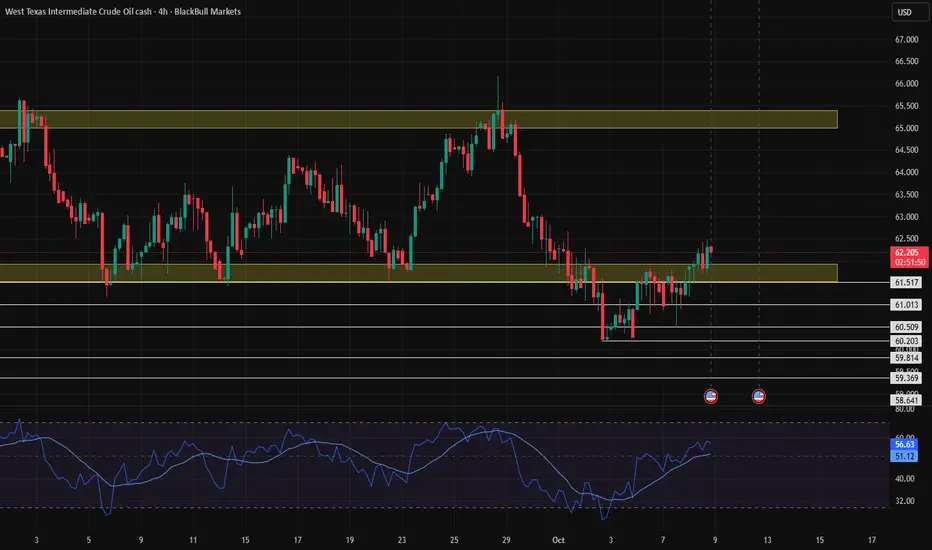
US OIL SUPPORT, RESISTANCE & TRENDLINE ANALYSISAs posted on 6th October US Oil moved upside when it broke the mentioned levels.
We have quiet a room for "LONG" position. Go for LONG only if it breaks 62.72 and might touch 63.03 and if it breaks this as well it might go further up till 63.34.
For "SHORT" positions plan only if it breaks 62.10 and it might lead to 61.72 and 61.26.
Breaking the trendline should also indicate and upward movement.
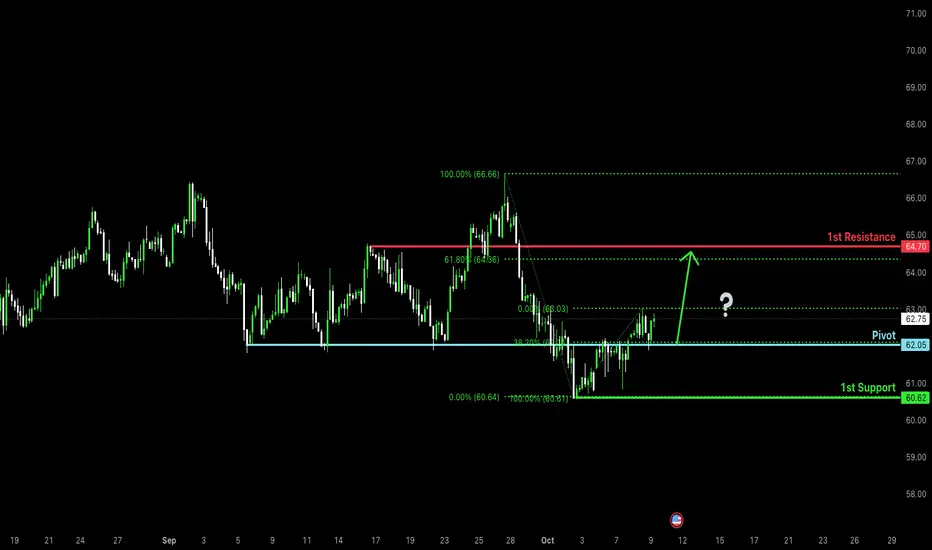
Bullish rebound at major support level?WTI Oil (XTI/USD) has bounced off the pivot, which has been identified as an overlap support that lines up with the 38.2% Fibonacci retracement and could rise to the 1st resistance.
Pivot: 62.05
1st Support: 60.62
1st Resistance: 64.70
Disclaimer:
The above opinions given constitute general market commentary, and do not constitute the opinion or advice of IC Markets or any form of personal or investment advice.
Any opinions, news, research, analyses, prices, other information, or links to third-party sites contained on this website are provided on an "as-is" basis, are intended only to be informative, is not an advice nor a recommendation, nor research, or a record of our trading prices, or an offer of, or solicitation for a transaction in any financial instrument and thus should not be treated as such. The information provided does not involve any specific investment objectives, financial situation and needs of any specific person who may receive it. Please be aware, that past performance is not a reliable indicator of future performance and/or results. Past Performance or Forward-looking scenarios based upon the reasonable beliefs of the third-party provider are not a guarantee of future performance. Actual results may differ materially from those anticipated in forward-looking or past performance statements. IC Markets makes no representation or warranty and assumes no liability as to the accuracy or completeness of the information provided, nor any loss arising from any investment based on a recommendation, forecast or any information supplied by any third-party.
us oilHI GUYS,
we are bearish on us .oil
Area of interest will be a test around fib -level 0.236
we shall witness a massive continuation sell in NEW YORK, LONDON session. ryt now am in a scalp buy entry early morning sweep.

US OILHI GUYS,
US.OIL has given us an entry in new york session ,
we expect an HS h1, h2 around fib level 1.414.
we are bullish

Oil AnalysisAs we mentioned in our previous analysis, we expected the price to return inside the range — and that’s exactly what happened. Now, our current expectation is for the price to continue rising toward **$65 per barrel**.
GoingUp: WestTexasCrudeCrude has been anything but friendly however it has also been adamant on growing no matter the cost.
Crude Oil has aggressively passed every reason to decrease AND is still refusing to go further down. That is also the case with Crude Oil Bulls. They have substantial reasons to go long but are meet at an impasse because the economy has no report on direction. The information they do have isn’t promising and the US Government shutdown isn’t helping the matter of uncertainty either.
I mean it’s a roller coaster of emotions BUT you don’t play with your feelings you use your head and the logic is if it meets the criteria it will stand the test and this asset is signaling Long again.
Im relying on my usual supportive reasoning and insight from world news to assess this trade but with sentiment so finicky it’s never that cut and dry.
Regardless of what you gotta pay to play and since the market wants to take risks you might as well take risks too.
Just remember the market has nothing to lose but you do so be mindful how much play money you want to spend.
Now have a Prosperous Trade and God Bless

WTI crude oil Wave Analysis – 8 October 2025
- WTI crude oil reversed from round support level 60.00
- Likely to rise to resistance level 64.00
WTI crude oil recently reversed up from the support zone surrounding the round support level 60.00 (which has been reversing the price from the middle of May).
The upward reversal from the support level 60.00 created the daily Japanese candlesticks reversal pattern Hammer.
Given the strength of the nearby support level 60.00 and the oversold daily Stochastic, WTI crude oil can be expected to rise to the next resistance level 64.00.

Today Lets Trade on Crude - Oil
If market Break above - level of 6.515 on - 4 Hours Chart" then can buy entry
your target profit will be - 64.631
........................................................
If market Goes bellow 61.707 then we can expect will fall down -
will formed Bearish Flag Pattern
target profit - 59.036
HI Retail Trader.
Check Below Chart
This subject to Educational Purpose"
Please Do your own Analyzation and Use Proper Risk - Money management
And Trade"
Smart Money Concept
Follow My Channel 🔥🔥🔥

us oilHI GUYS.
well shit happens.
us oil has switched to H1, H2 CHART ANALYSIS.
waiting for pull back to adjust technical around new York session, then I scalp buys for an incoming HS at the top. will post soon around areas of interest

USOIL NEXT POSSIBLE MOVE USOIL is trading near a strong demand zone where buyers have previously shown interest. If the price continues to respect this support area, a bullish move can be expected.
Market structure remains positive above support, suggesting buyers may regain momentum soon.

USCRUDEOIL - Up ChannelHi Traders,
We are following the price in the "Up Channel". I am not a wave trader but i do understand the concept. the ABC are just for drawing purposes not the exact science of it.
With that said, lets BUY CMCMARKETS:USCRUDEOIL
Price Action:
Price is moving within a clear ascending channel
Good Luck
Study, Study, Study Lorenzo Tarati

Crude Oil: Bullish Momentum Builds Above $62.13FenzoFx—Crude Oil tapped into the liquidity below the equal lows at $62.13. However, the cumulative volume profile did not form new lower lows. This means the market could be bullish, at least in the short term.
Therefore, we expect Oil to rise higher. The immediate resistance is at $62.74. From a technical perspective, the price could target the bearish FVG with resistance at $64.84 if bulls close and stabilize the price above $62.74.

Trade On - Crude Oil - Trading Opportunity HI Retail Trader.
Check Below Chart
This subject to Educational Purpose"
Please Do your own Analyzation and Use Proper Risk - Money management
And Trade"
Smart Money Concept
Please Subscribe my Channel and follow me 🔥🔥🔥

WTI Crude Oil – Bearish Continuation Below Key SupportWTI Crude Oil has broken below the 61.717 support, signaling continued downside momentum after failing to recover from the recent drop off 66.280. Sellers remain in control as the market pushes toward the next support zone.
Support at: 59.869 🔽 / 55.451 🔽
Resistance at: 61.717 🔼 / 63.090 🔼
🔎 Bias:
🔼 Bullish: Only if price reclaims 61.717, indicating a potential short-term reversal toward 63.090.
🔽 Bearish: As long as price remains below 61.717, the next bearish targets lie at 59.869 and possibly 55.451.
📛 Disclaimer: This is not financial advice. Trade at your own risk.

WTI 1H🔹 Overall Outlook and Potential Price Movements
In the charts above, we have outlined the overall outlook and possible price movement paths.
As shown, each analysis highlights a key support or resistance zone near the current market price. The market’s reaction to these zones — whether a breakout or rejection — will likely determine the next direction of the price toward the specified levels.
⚠️ Important Note:
The purpose of these trading perspectives is to identify key upcoming price levels and assess potential market reactions. The provided analyses are not trading signals in any way.
✅ Recommendation for Use:
To make effective use of these analyses, it is advised to manually draw the marked zones on your chart. Then, on the 15-minute time frame, monitor the candlestick behavior and look for valid entry triggers before making any trading decisions.

USOIL: Absolute Price Collapse Ahead! Short!
My dear friends,
Today we will analyse USOIL together☺️
The in-trend continuation seems likely as the current long-term trend appears to be strong, and price is holding below a key level of 60.750 So a bearish continuation seems plausible, targeting the next low. We should enter on confirmation, and place a stop-loss beyond the recent swing level.
❤️Sending you lots of Love and Hugs❤️
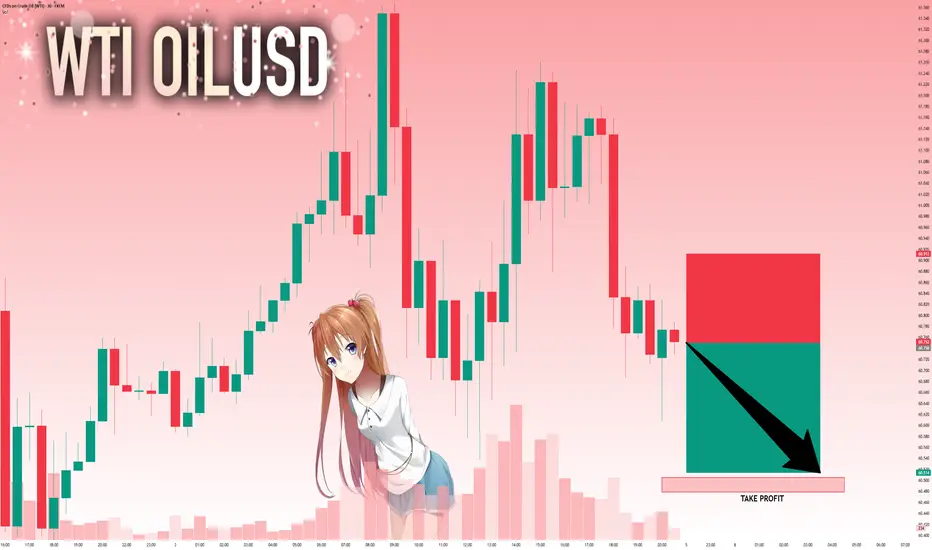
USOIL WILL GO DOWN|SHORT|
✅WTI OIL Price rejects supply after distribution and forms bearish orderflow, ICT suggests liquidity is being targeted below. Market likely seeks drawdown into 60.00 demand imbalance. Time Frame 4H.
SHORT🔥
✅Like and subscribe to never miss a new idea!✅

Oil prices extend losses on supply concernsOil prices extend losses on supply concerns
Oil prices slipped Thursday, extending last week’s decline on oversupply worries and uncertainty from the U.S. government shutdown. Expectations that OPEC+ may raise output by up to 500,000 bpd in November, along with forecasts of a potential glut, weighed on sentiment.
Geopolitical risks remain in focus, with the G7 vowing tighter controls on Russian oil and the U.S. set to aid Ukraine with intelligence for strikes on energy infrastructure. Still, Chinese stockpiling helped limit losses. Concerns over Russian supply disruptions and steady Chinese stockpiling provided some support, but U.S. data showing rising crude and fuel inventories added to bearish pressure.

CRUDE OIL Free Signal! Buy!
Hello,Traders!
CRUDE OIL taps into a horizontal demand area, showing strong bullish reaction. Liquidity beneath recent lows is swept, signalling smart money positioning for upside continuation.
-------------------
Stop Loss: 61.35$
Take Profit: 62.87$
Entry: 61.94$
Time Frame: 8H
-------------------
Buy!
Comment and subscribe to help us grow!
Check out other forecasts below too!
Disclosure: I am part of Trade Nation's Influencer program and receive a monthly fee for using their TradingView charts in my analysis.
