USOIL continues to decline on oversupply concerns
Oil prices tumbled on oversupply fears as major producers ramped up output. Reuters reported that ahead of the OPEC+ meeting on October 5th, November production hikes could exceed the planned 137,000 barrels per day. The resumption of Kurdish oil exports and prospects of additional supply may further pressure prices.
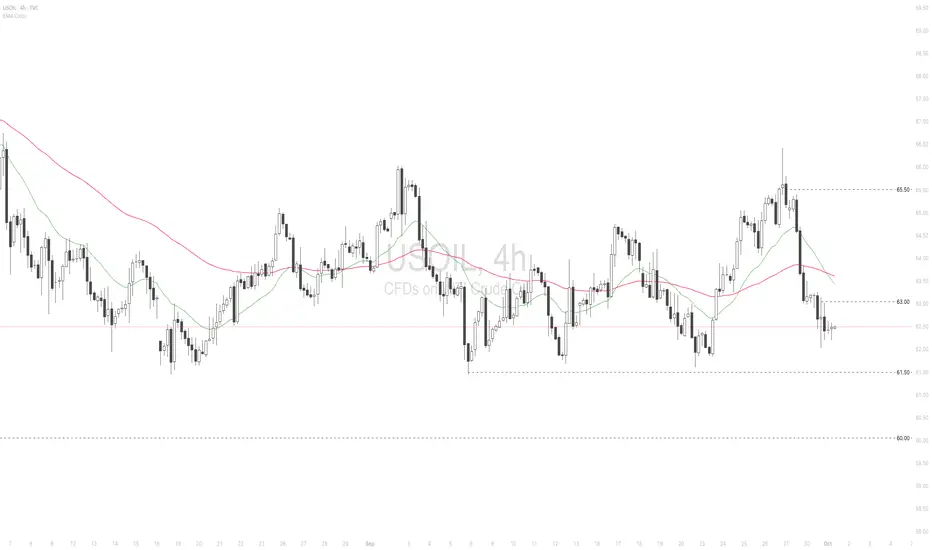
USOIL extended its decline before consolidating within the 61.50–63.00 range. The death cross of the EMAs points to a potential shift toward bearish momentum. If USOIL breaks below the 61.50 support, the price could retreat toward 60.00. Conversely, if USOIL breaks above the 63.00 resistance, the price may advance toward 65.50.
WTI trade ideas
Crude oil - down trend continuesAs previously posted, Crude oil down trend continues in 4hrs time frame. It can be fall upto the green line marked support.

WTI Wave Analysis – 29 September 2025- WTI reversed from resistance level 65.25
- Likely to fall to support level 61.70
WTI crude oil recently reversed down from the the resistance area between the resistance level 65.25 (upper border of the active sideways price range from the start of August).
The resistance level 65.25 was strengthened by the upper daily Bollinger Band and by the 50% Fibonacci correction of the downward impulse from the end of July.
WTI crude oil can be expected to fall to the next support level 61.70 (lower border of the active sideways price range).

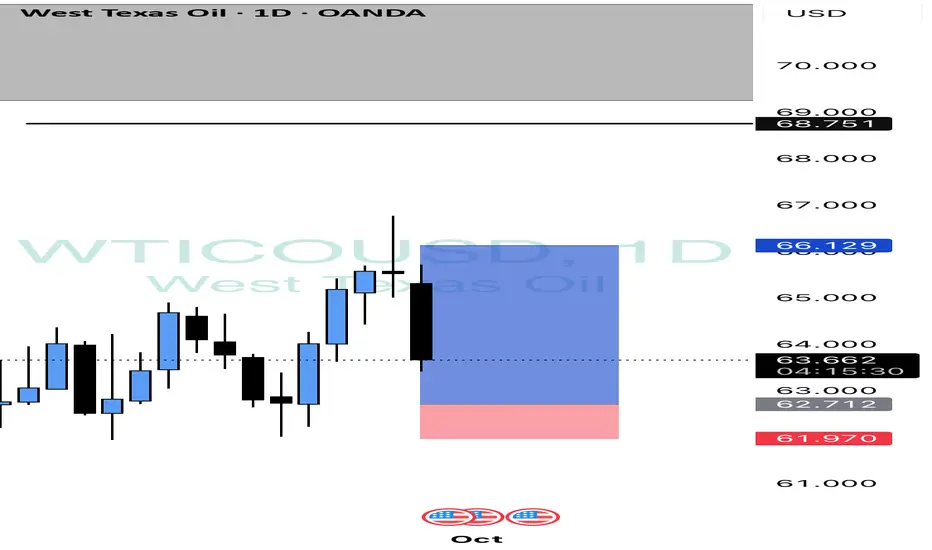
Usoil Daily 🛢️ The oil chart hit the target we had set in our previous buy setup. We still maintain a bullish outlook in this zone, and if the price drops further, it could trigger our next trade.

Usoil Daily
🛢️ The oil chart hit the target we had set in our previous buy setup. We still maintain a bullish outlook in this zone, and if the price drops further, it could trigger our next trade.
#CrudeOil #OilTrading #WTI #TechnicalAnalysis #BuySetup #TradingView #Forex #Commodities #PriceAction
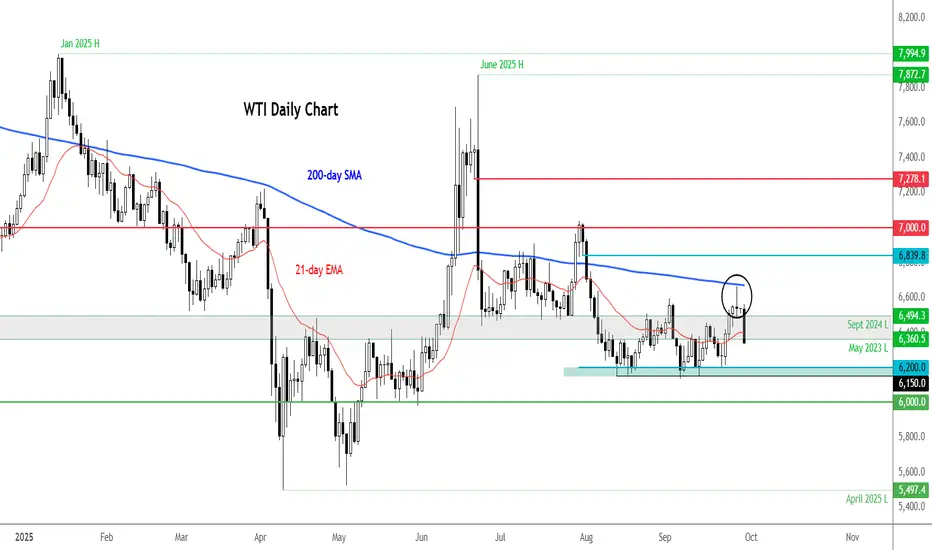
WTI extends drop after 200 MA testAfter printing an inverted hammer off its 200-day average on Friday, we have seen a sharp slide in oil prices today.
Reports that the OPEC+ plans another increase to output in November is not helping the cause, with the market already fearful over excessive supply and weak demand growth.
Key support at 61.50 to 62.00 area was tested multiple times last week and it held. A break below that zone this week could be pivotal, if seen.
Resistance seen at 65.00 now, then the area between 66.50-67.00 - marking the 200 day MA.
By Fawad Razaqzada, market analyst with FOREX.com
Overbought NO where in Sight I keep seeing people stating that Crude is overbought but on the 1day time frame it is just beginning.
If it were me I would be mindful of placing short orders for oil at this time and continue to look for long opportunities during the NY sessions.
Thats just me though 🤷🏽♀️
Supply and demand dynamics are dominating the oil marketSupply and demand dynamics are dominating the oil market
Technical Analysis
USOIL is consolidating within a horizontal channel between 61.50 and 66.00. The multi-period EMA is converging, indicating an accumulation phase before a breakout, in which the direction could determine the next trend.
Since the preceding trend was a downtrend and the price remains within a broader descending channel, the bias is more to the downside. Therefore, any rebound near the channel's upper bound is seen as a potential opportunity.
If USOIL fails to break above the horizontal channel's upper bound at 66.00, the price may reverse downwards to retest the lower bound around 61.50, with the potential to break lower towards the year's low of 55.00.
However, if USOIL breaks above the upper bound of the sideways range, it could test the upper bound of the broader descending channel around 70.50.
Fundamental Analysis
WTI crude oil prices are influenced by a mix of rising supply and price-supporting geopolitical events.
The resumption of crude exports from Iraqi Kurdistan, after a 2.5-year halt, is adding to the global supply, starting at 180,000–190,000 barrels per day (bpd) and expected to rise to around 230,000 bpd. Meanwhile, OPEC+ is considering a production increase of at least 137,000 bpd, reinforcing concerns about a year-end supply surplus.
However, news of attacks on energy infrastructure in Eastern Europe and measures to restrict fuel exports spark a short-term bullish momentum and increasing volatility.
Despite this, the factors truly dominating oil prices are weak demand and excess supply. Geopolitics remains an event risk with short-term, one-time effects. Therefore, prices continue to face headwinds overall.
Additionally, prices may fluctuate based on upcoming weekly inventory reports and dynamic production news that could exert further pressure.
Analysis by: Krisada Yoonaisil, Financial Markets Strategist at Exness

OIL Technical & Order Flow AnalysisOur analysis is based on a multi-timeframe top-down approach and fundamental analysis.
Based on our assessment, the price is expected to return to the monthly level.
DISCLAIMER: This analysis may change at any time without notice and is solely intended to assist traders in making independent investment decisions. Please note that this is a prediction, and I have no obligation to act on it, nor should you.
Please support our analysis with a boost or comment!

US OilCrude Oil
- Break of Structure
- Completed " 12345 " Impulsive Waves
- Fair Value Gap
- Exp FIAT as an corrective pattern in Short Time Frame
- Order Block


Crude oil review -DAILY- 29/09/2025Oil prices slipped at the start of the week as expectations of another OPEC+ production hike in November added to oversupply worries. West Texas Intermediate hovered near $65, with the alliance led by Saudi Arabia considering raising output beyond the already scheduled October increase of 137,000 barrels a day. Most members, aside from Saudi Arabia, are already at their production ceilings, meaning actual supply growth will likely fall short of official targets. Still, China’s strong crude purchases have helped prices remain relatively supported. The International Energy Agency warned of a record surplus in 2026 as OPEC+ revives more supply while rival producers expand output. Goldman Sachs projects crude could slide into the mid-$50s next year despite ongoing Chinese stockpiling.
On the technical side, crude oil prices have been trading in a sideways channel formation with upper and lower boundaries around $66 and $62, respectively. Currently, the price is testing the resistance of the 100-day moving average, just below the upper boundary of the channel. The Stochastic oscillator is near extreme overbought levels, while the moving averages validate an overall bearish trend.
Disclaimer: The opinions in this article are personal to the writer and do not reflect those of Exness

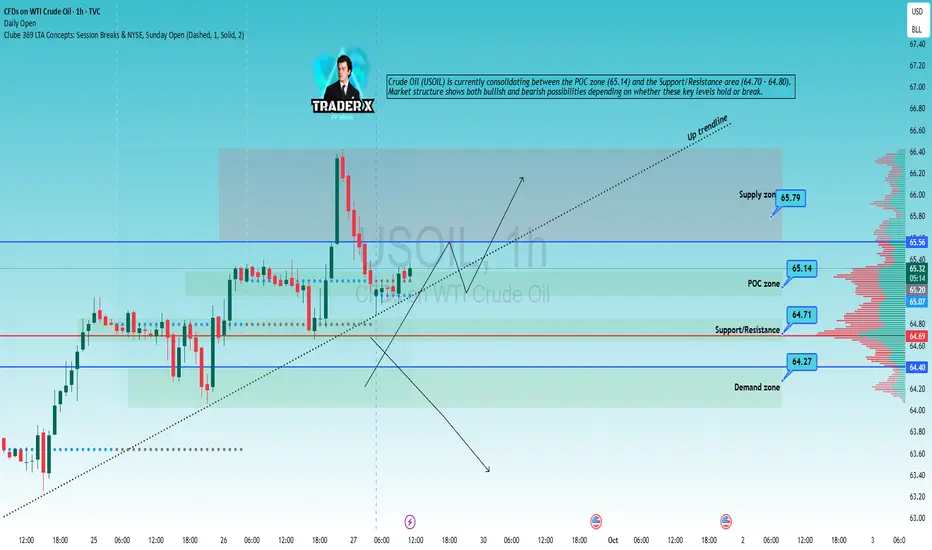
USOIL H1 – Trading Plan I SEP/29/2025Crude Oil (USOIL) is currently consolidating between the POC zone (65.14) and the Support/Resistance area (64.70 – 64.80). Market structure shows both bullish and bearish possibilities depending on whether these key levels hold or break
Here are 4 possible scenarios with entry signals to watch:
📊 Scenario 1 – Rebound from Support/Resistance
Watch zone: 64.70 – 64.80 (Support/Resistance).
Price action: Bullish reversal candlestick (Pin bar, Bullish engulfing) with volume confirmation.
Trading signal:
👉 Buy around 64.70 – 64.80
🎯 TP1: 65.14 (POC zone)
🎯 TP2: 65.56 – 65.79 (Supply zone)
⛔ SL: below 64.40 (Demand zone).
📊 Scenario 2 – Breakout above Supply Zone
Watch zone: 65.56 – 65.79 (Supply zone).
Price action: H1 candle closes above 65.80 with strong volume.
Trading signal:
👉 Buy breakout above 65.80
🎯 TP1: 66.20
🎯 TP2: 66.80
⛔ SL: below 65.40.
📊 Scenario 3 – Breakdown of Support/Resistance
Watch zone: 64.70 – 64.80.
Price action: H1 candle closes below 64.70 with strong bearish momentum.
Trading signal:
👉 Sell on pullback to 64.70
🎯 TP1: 64.40 (Demand zone)
🎯 TP2: 63.80
⛔ SL: above 65.10.
📊 Scenario 4 – Breakdown of Demand Zone
Watch zone: 64.20 – 64.40 (Demand zone).
Price action: H1 candle closes below 64.20 with increasing volume.
Trading signal:
👉 Sell breakout below 64.20
🎯 TP1: 63.60
🎯 TP2: 63.00
⛔ SL: above 64.60.
👉 Summary:
Holding above 64.70 favors Buy setups.
Breaking below 64.70 favors Sell setups.
Key short-term battle zone: 65.56 – 65.79 Supply area.
⚠️ Disclaimer:
This analysis is for educational and informational purposes only and should not be considered financial advice. Trading in financial markets involves significant risk, and you should only trade with capital you can afford to lose. Always do your own research before making any trading decisions.
USOIL: Bears Will Push
The analysis of the USOIL chart clearly shows us that the pair is finally about to tank due to the rising pressure from the sellers.
Disclosure: I am part of Trade Nation's Influencer program and receive a monthly fee for using their TradingView charts in my analysis.
❤️ Please, support our work with like & comment! ❤️

Upward trend in oilCurrently, the oil trend is bullish and we can expect a price rebound in one of the specified demand ranges.

USOIL: The Market Is Looking Down! Short!
My dear friends,
Today we will analyse USOIL together☺️
The in-trend continuation seems likely as the current long-term trend appears to be strong, and price is holding below a key level of 65.189 So a bearish continuation seems plausible, targeting the next low. We should enter on confirmation, and place a stop-loss beyond the recent swing level.
❤️Sending you lots of Love and Hugs❤️

Crude oil - Negetive Divergence In RSI + Major resistance levelCrude oil - Negetive Divergence In RSI + Major resistance level

USOIL: 70$ BREAKOUT ROCKET FUELED! Black Gold Rally 🛢️ USOIL: 70$ BREAKOUT ROCKET FUELED! Black Gold Rally 📊
Current Price: $65.465 | Date: Sept 27, 2025 ⏰
📈 INTRADAY TRADING SETUPS (Next 5 Days)
🎯 BULLISH SCENARIO
Entry Zone: $65.20 - $65.60 📍
Stop Loss: $64.80 🛑
Target 1: $66.50 🎯
Target 2: $67.30 🚀
🎯 BEARISH SCENARIO
Entry Zone: $65.80 - $66.20 📍
Stop Loss: $66.60 🛑
Target 1: $64.70 🎯
Target 2: $64.00 📉
🔍 TECHNICAL ANALYSIS BREAKDOWN
📊 KEY INDICATORS STATUS:
RSI (14): 59.4 ⚡ Bullish Momentum Zone
Bollinger Bands: Mid-Band Breakout 🔥
VWAP: $65.35 - Acting as Springboard 💪
EMA 50: $64.80 ✅ Golden Cross Setup
Volume: Institutional Interest Rising 📊
🌊 WAVE ANALYSIS:
Elliott Wave: Wave 3 Impulse Loading 🌊
Fibonacci Target: $68.50 (161.8%) 🎯
🔄 HARMONIC PATTERNS:
Bullish Bat Completion at $64.90 ✨
ABCD Pattern targeting $67.20 🔄
⚖️ SWING TRADING OUTLOOK (1-4 Weeks)
🚀 BULLISH TARGETS:
Psychological: $70.00 🏆
Weekly Resistance: $68.80 🌙
Gann Level: $69.25 ⭐
📉 BEARISH INVALIDATION:
Weekly Support: $63.50 ⚠️
Critical Break: $62.00 🚨
🎭 MARKET STRUCTURE:
Trend: Ascending Triangle 💪
Momentum: Energy Building 🔥
Wyckoff Phase: Accumulation End 📈
Ichimoku: Bullish Cloud Entry 🟢
⛽ OIL MARKET DYNAMICS:
Supply Cuts: OPEC+ Extensions 🛢️
Demand Growth: Winter Season 🌨️
Inventory Draws: Bullish Data 📉
Geopolitical Premium: Risk-On ⚔️
⚡ RISK MANAGEMENT:
Max Risk per Trade: 2% 🛡️
R:R Ratio: Minimum 1:2 ⚖️
Breakout Confirmation: $66.00 hold 📏
🌍 FUNDAMENTAL CATALYSTS:
EIA Reports Supporting Bulls 📈
Middle East Tensions Premium 🌍
China Demand Recovery Signs 🏭
US Dollar Weakness Helping 💵
🔥 CRITICAL LEVELS TO WATCH:
Breakout Zone: $66.00-$66.30 💥
Support Cluster: $65.00 | $64.50 | $64.00 🛡️
Resistance: $66.50 | $67.50 | $68.00 🚧
🎯 FINAL VERDICT:
WTI primed for $70 EXPLOSIVE RALLY! 🚀
Black Gold showing institutional love! 💎
Supply-demand imbalance = bullish fuel! ⛽
Trade Management: Buy dips above $65.00 💰
Breakout Watch: $66.30 decisive level! 🔔
---
⚠️ Disclaimer: Commodity trading carries high risk. Use appropriate position sizing. Educational analysis only.
For individuals seeking to enhance their trading abilities based on the analyses provided, I recommend exploring the mentoring program offered by Shunya Trade. (Website: shunya dot trade)
I would appreciate your feedback on this analysis, as it will serve as a valuable resource for future endeavors.
Sincerely,
Shunya.Trade
Website: shunya dot trade
🔔 Follow Oil Market Updates | 💬 Drop Your $70 Oil Timeline

WTI 4H🔹 Overall Outlook and Potential Price Movements
In the charts above, we have outlined the overall outlook and possible price movement paths.
As shown, each analysis highlights a key support or resistance zone near the current market price. The market’s reaction to these zones — whether a breakout or rejection — will likely determine the next direction of the price toward the specified levels.
⚠️ Important Note:
The purpose of these trading perspectives is to identify key upcoming price levels and assess potential market reactions. The provided analyses are not trading signals in any way.
✅ Recommendation for Use:
To make effective use of these analyses, it is advised to manually draw the marked zones on your chart. Then, on the 15-minute time frame, monitor the candlestick behavior and look for valid entry triggers before making any trading decisions.

OIL (WTI) – Trading Plan | Sep 26, 2025🔎 Technical Analysis of OIL (WTI) – Sep 26, 2025
1. Main Trend
- On the H1 timeframe, oil is in a medium-term uptrend, reflected by the ascending trendline extending from Sept 24 until now.
- Price has just had a strong breakout above the weekly VAH (65.45), confirming buying pressure dominance.
2. Key Zones
Resistance:
- 65.80 – 66.00: short-term resistance recently rejected.
- 66.50 – 67.00: stronger resistance zone, overlapping the previous swing high.
Support:
- 65.45 (VAH): nearest support; as long as price stays above this, the uptrend is reinforced.
- 65.10 – 64.60 (POC): central support, balance area.
- 63.00 – 62.90 (VAL): deeper support, previous volume low.
3. Price Action
-- Price had a strong breakout candle up to 66.00 but was rejected, now pulling back slightly toward VAH 65.45.
- The breakout was accompanied by large volume → buyers are in control, but short-term profit-taking pressure is appearing.
- If price holds above VAH, the uptrend will likely continue. If it falls back below POC 64.60, selling pressure may return.
4. Candlestick Pattern
- A rejection candle appeared at 66.00 with a long upper wick → short-term bearish signal.
- However, candles around VAH show small bodies → market is waiting for pullback confirmation.
5. Trading Plan (in order of priority)
📌 Scenario 1 – Buy with the trend (priority):
- Buy if price retests VAH 65.45 successfully or around POC 65.10 – 64.60.
- TP: 66.00 → 66.50 → extended to 67.00.
- SL: below 64.40.
📌 Scenario 2 – Buy breakout continuation:
- If price breaks above 66.00 with a strong H1 candle.
- Enter Buy on breakout.
- TP: 66.50 – 67.00.
- SL: below 65.45.
📌 Scenario 3 – Short-term Sell (only if clear signals appear):
- If price fails to hold VAH 65.45 and breaks POC 64.60.
- Enter Sell with momentum.
- TP: 63.00 – 62.90 (VAL).
- SL: above 65.80.
👉 Summary:
- Priority remains on Buy as long as price holds above VAH 65.45.
- If breakout above 66.00 succeeds → continue Buying with the trend.
- Only consider Selling if price drops below POC 64.60.
👉 If you find this analysis useful, don’t forget to hit like 👍 and drop a comment 💬 to support us in delivering even better insights! Or join my channel to get free signal.

OIL (WTI) – Trading Plan | Sep 25, 20251. Main Trend
- On the H1 timeframe, crude oil is still maintaining an uptrend with a higher high – higher low structure.
- However, the short-term trend is showing signs of losing momentum, as price has broken below the H1 uptrend line and is now oscillating around the POC zone.
2. Key Zones
Resistance:
- 64.95 (CW VAH): Strong resistance, repeatedly tested but not yet broken.
- 65.20 – 65.50: Extended zone if a breakout succeeds.
Support:
- 64.70 – 64.65 (CW POC): Key price zone, where price is currently consolidating.
- 62.85 (CW VAL): Deeper support, overlapping with the previous volume base.
3. Price Action
- After breaking up to 64.95, price failed to sustain bullish momentum, forming multiple upper-wick candles → selling pressure dominates.
- Currently, price has fallen below the H1 trendline and is retesting the POC zone (64.65 – 64.70).
+If POC holds, price may rebound to retest 64.95.
+If POC breaks, price is likely to drop deeper towards 63.50 → 62.85 (VAL).
4. Candlestick Pattern
- Several long lower-wick candles have appeared around the POC → showing defensive buying pressure.
- However, recent bearish candles have relatively large bodies → signals remain unclear, confirmation is needed.
5. Trading Plan
📌 Scenario 1 – Buy with the main trend (priority):
-Buy around 64.65 – 64.70 (POC) if there is a clear bullish reversal signal (pin bar / bullish engulfing).
- Target: 64.95 → 65.20 → further to 65.50.
📌 Scenario 2 – Sell if POC breaks:
- Sell if price breaks decisively below 64.60 and fails on retest.
- Target: 63.50 → 62.85 (VAL).
👉 Summary: Crude oil remains in a long-term uptrend, but short-term momentum is weakening. The decision point lies at POC 64.65 – 64.70:
+If it holds → Buy up.
+If it breaks → Sell down.
👉 If you find this analysis useful, don’t forget to hit like 👍 and drop a comment 💬 to support us in delivering even better insights! Or join my channel to get free signal.

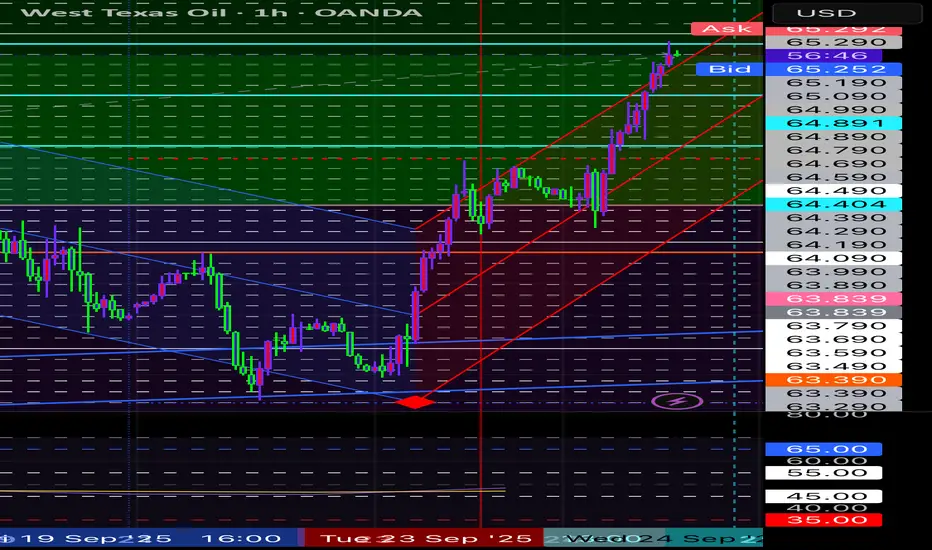
Oil Bulls Beware: 65.5 Could Be the Turning Point📲 NFX Oil Trade Alert – Quick View
GBEBROKERS:USOIL – Resistance Test in Play
📍 Current Level: 65.00
📈 Next Target: 65.45–65.90 (38.2% Fib + Supply-Demand Zone)
⚠️ RSI likely to hit overbought at this zone → potential short setup
📉 Bias: Bearish rejection at 65.5 (preferred scenario) → Target back to 62
🔎 Catalyst: Bullish ECONOMICS:USGPRO EIA report, but effect already priced in from Monday’s rally.
📊 Oil Trade Analysis – Detailed Breakdown
FX:USOIL tested 65.00 after breaking out of the 64.1–64.5 SR zone post–EIA report (23.6% Fib retracement). This marks the second bullish report in a row, but this one was weaker, and the reaction looks mostly priced in after the rally from Monday to today.
Currently, price is hovering around 65.00, which is acting as a minor support. While this level may hold temporarily, it’s unlikely to sustain against broader resistance at 65.5.
I’m expecting price to push further towards the 38.2% Fib retracement (65.45–65.90), which also aligns with a major supply-demand zone. At this level, RSI will likely flash overbought, making it my preferred area to look for shorts.
🔀 Scenarios
Path A – Bearish Rejection (Most Probable)
Resistance holds at 65.5 zone.
Expectation: Sharp rejection → price retraces back to 62 (lower band of range).
Path B – Extended Rally (Less Probable)
Price breaks and sustains above 65.9.
Would invalidate immediate short setup and open path towards higher Fib levels.
⚖️ Fundamentals
While the EIA report acted as a short-term catalyst, supply hike remains a heavy bearish overhang. Nothing has changed on the bigger picture.
💬 Game Plan
Watching closely for clear rejection at 65.5. That’s where I’ll be pulling the trigger for shorts.

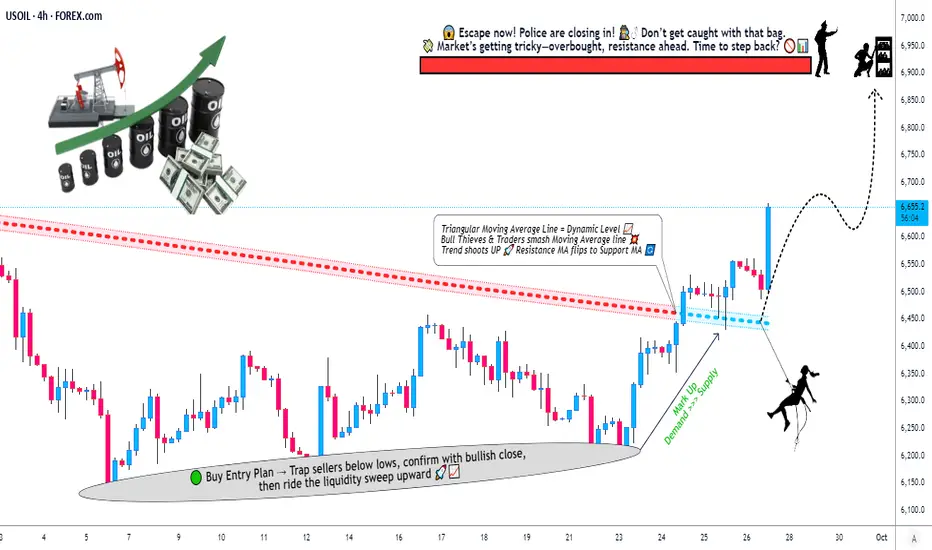
Crude Oil Trading Map: Bullish Momentum vs Key Resistance🛢️ WTI Crude Oil (USOIL/XTIUSD) – Energies Market Wealth Strategy Map ⚡
🎯 Trade Plan (Swing/Day Trade Vibe)
📌 Bias: Bullish setup confirmed by Triangular Moving Average dynamic resistance breakout.
💰 Entry (Thief Layering Strategy):
We don’t just walk in the front door — we layer like true OG’s.
Buy Limit Layers: 6450, 6500, 6550, 6600
You can always add more “layers” depending on your conviction & style.
🛑 Stop Loss (Thief Escape Plan):
Suggested SL: 6350
⚠️ Note: Dear Ladies & Gentlemen (Thief OG’s) — I’m not recommending you use only my SL. Risk is yours, profit is yours. Protect your bag your way.
🎯 Target Zone (Profit Heist Exit):
First escape point: 6900
Above here? Careful. Around 6950 sits a Police Barricade 🚔 (Resistance + Overbought Trap). That’s where the chase gets real — don’t overstay!
🔑 Key Notes for the Thief OG’s:
Layering Strategy: Spreading entries reduces exposure & maximizes flexibility.
Dynamic Resistance Breakout: Momentum shift confirms bulls are sneaking in.
Psychological Trap @6950: Overbought zones = potential reversals.
🔗 Correlation & Related Pairs to Watch:
TVC:USOIL / FXOPEN:XTIUSD (Primary Chart)
BLACKBULL:BRENT / TVC:UKOIL → Closely tracks WTI, sometimes diverges.
FX:USDJPY & TVC:DXY → Oil often inversely correlated with the US Dollar.
OANDA:XAGUSD & OANDA:XAUUSD → Commodity cousins, useful for cross-market sentiment.
FOREXCOM:SPX500 & NASDAQ:NDX → Risk-on sentiment can boost crude oil demand outlook.
✨ “If you find value in my analysis, a 👍 and 🚀 boost is much appreciated — it helps me share more setups with the community!”
⚠️ Disclaimer: This is a Thief Style Trading Strategy — just for fun and market education. Not financial advice. Trade at your own risk.
#USOIL #XTIUSD #CrudeOil #WTI #EnergyMarkets #SwingTrade #DayTrading #TechnicalAnalysis #TradingStrategy #ThiefStrategy