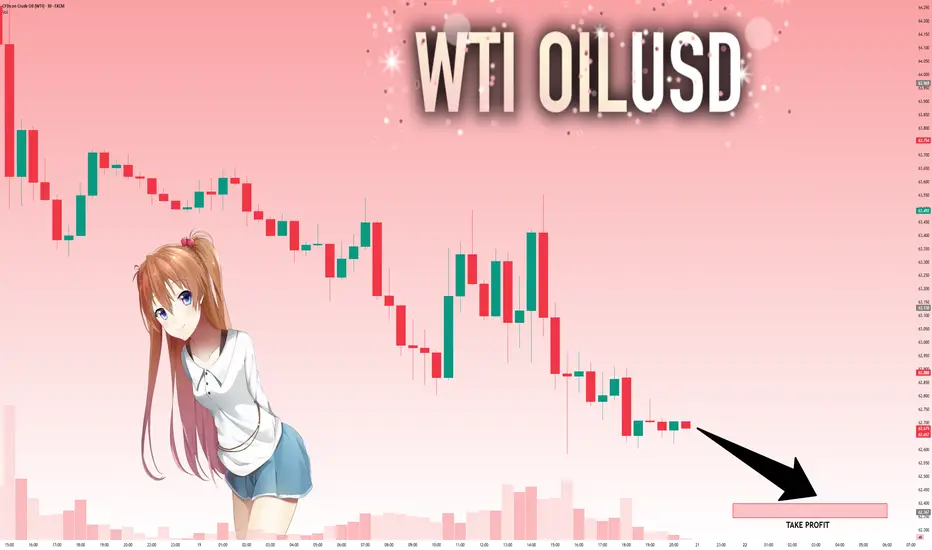
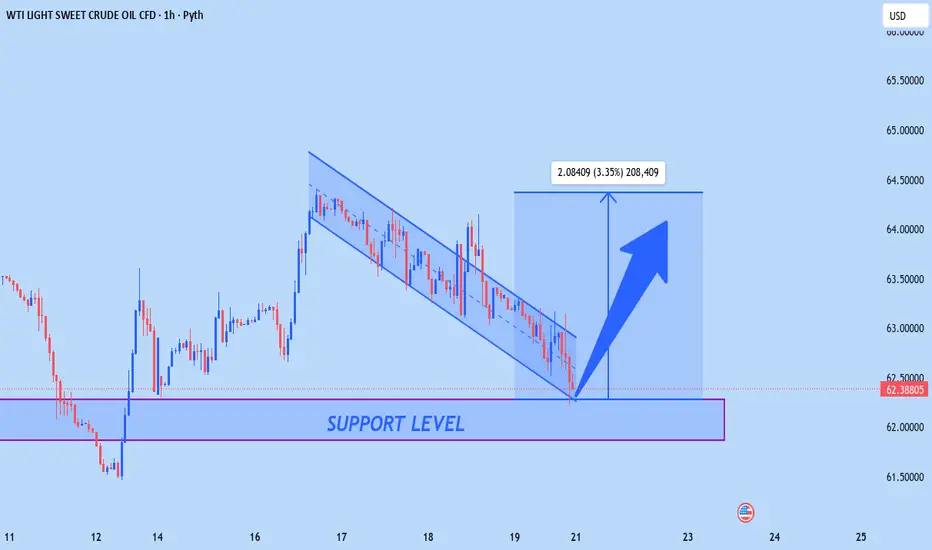
Crude Oil - Down Fall In 1 Hour Time Frame we can see a Good down Trend formed"
Use the Opportunity and Trade
Use Proper Risk Management" 🔥🔥🔥
WTI trade ideas

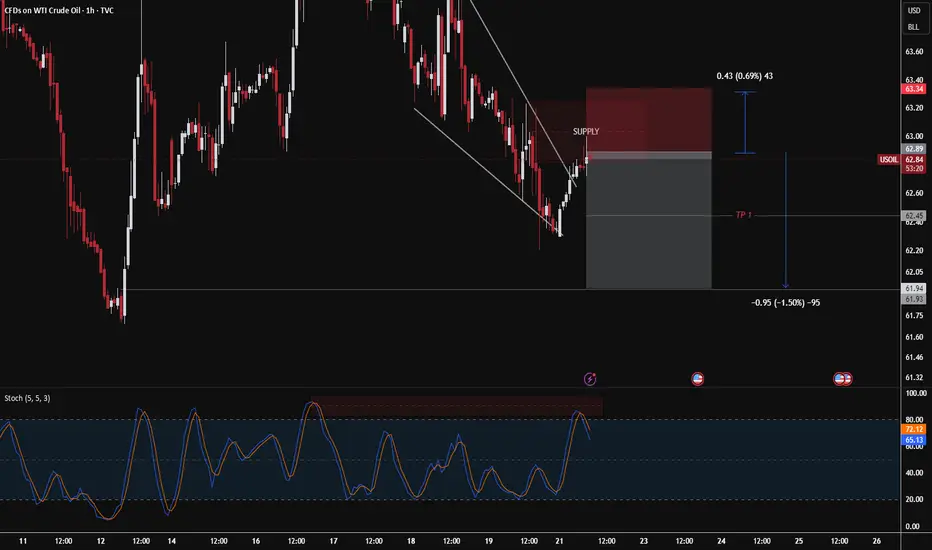
US OIL 🔴 **Entry Zone (Supply):**
≈ 62.89 – 63.34
🔻 **Stop Loss (SL):**
63.34
🎯 **Take Profit (TP):**
* TP1 👉 62.45
* TP2 👉 61.93
📌 Catatan: Harga masuk area supply, potensi rejection turun. Risk kecil – reward lumayan lebar 👌
Bearish reversal?WTI Oil (XTI/USD) has rejected off the pivot and could drop to the 1st support which acts as a multi swing low support.
Pivot: 63.97
1st Support: 57.80
1st Resistance: 68.85
Disclaimer:
The above opinions given constitute general market commentary, and do not constitute the opinion or advice of IC Markets or any form of personal or investment advice.
Any opinions, news, research, analyses, prices, other information, or links to third-party sites contained on this website are provided on an "as-is" basis, are intended only to be informative, is not an advice nor a recommendation, nor research, or a record of our trading prices, or an offer of, or solicitation for a transaction in any financial instrument and thus should not be treated as such. The information provided does not involve any specific investment objectives, financial situation and needs of any specific person who may receive it. Please be aware, that past performance is not a reliable indicator of future performance and/or results. Past Performance or Forward-looking scenarios based upon the reasonable beliefs of the third-party provider are not a guarantee of future performance. Actual results may differ materially from those anticipated in forward-looking or past performance statements. IC Markets makes no representation or warranty and assumes no liability as to the accuracy or completeness of the information provided, nor any loss arising from any investment based on a recommendation, forecast or any information supplied by any third-party.

CRUDE OIL LONG FROM SUPPORT|
✅CRUDE OIL is going down to retest
A horizontal support around 61.80$
Which makes me locally bullish biased
And I think that we will see a rebound
And a move up from the level
Towards the target above at 62.80$
LONG🚀
✅Like and subscribe to never miss a new idea!✅

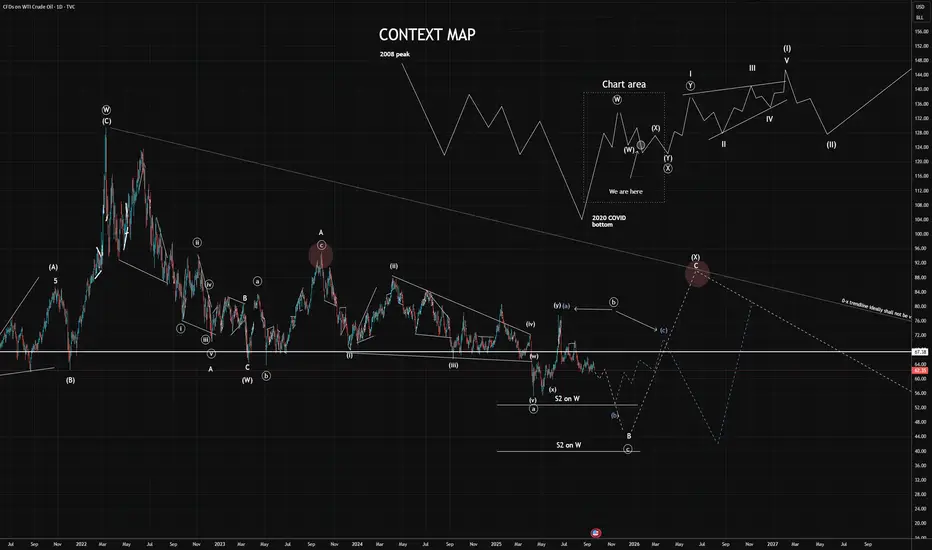
ROADMAP FOR OIL: Volatility Now, a Geopolitical Spark LaterThis isn't an update because the outlook has changed—it's been remarkably stable for months and even couple of years. Instead, this is about connecting the dots as we potentially approach a major inflection point.
Here’s the core idea: major geopolitical events aren't the drivers of crowd sentiment and price action. It's the other way around. Events like OPEC decisions or strikes on Iran happen when social mood has reached a tipping point, pushing politicians to act. These events cause volatility spikes on the chart but don't change the underlying trend; they simply create the corrective waves within it.
The chart is telling us that after the upcoming decline we're anticipating (based on wave count and indicators), a very powerful rally is due. This implies a major geopolitical catalyst, likely in late 2025 or 2026. Crucially, this spike will itself be just a large corrective wave up, setting the stage for the next major leg down in price.
The Technical Setup:
We're inside a complex double zigzag - - correction. The current (X) wave should unfold as either a combination (W)-(X)-(Y) or a flat pattern (A)-(B)-(C). A key tenet is that the trendline connecting the tops of and shouldn't be broken. That line is hard to define right now, which tells me the high for wave isn't in yet. This points to sustained and elevated volatility in the coming months.
The Big Picture (The Supercycle):
COVID likely marked the absolute bottom for energy prices. We are now in a major multi-decade upward supercycle. However, this cycle is so vast that we are still in its very first large wave. The entire corrective phase we're in now began in 2022 and could last until the late 2020s, potentially culminating in a global crisis sparked by conflict, escalating into trade wars, and exacerbated by the financial system vulnerabilities everyone is now preparing for.
Layer on top of that potential US production exhaustion and a post-2030 output decline across India and Asia, and you have a perfect recipe for a powerful oil rally in the future. But that story is for the next decade. For now, fasten your seatbelts for some turbulence.
#Oiltrading #ElliottWave #Socionomics #Macro #Trading #Geopolitics #Energy #Supercycle #Commodities
USOIL: Market of Buyers
Looking at the chart of USOIL right now we are seeing some interesting price action on the lower timeframes. Thus a local move up seems to be quite likely.
Disclosure: I am part of Trade Nation's Influencer program and receive a monthly fee for using their TradingView charts in my analysis.
❤️ Please, support our work with like & comment! ❤️

USOIL BULLISHAlthough the overall movement at the HTF Shows Bearish Trend .. The internal structures are still creating and taking orders before heading down ..
So for now using 2hr TF i am expecting bulls to take over a while to mitigate the Suppliers Point of interest.
Happy Trading

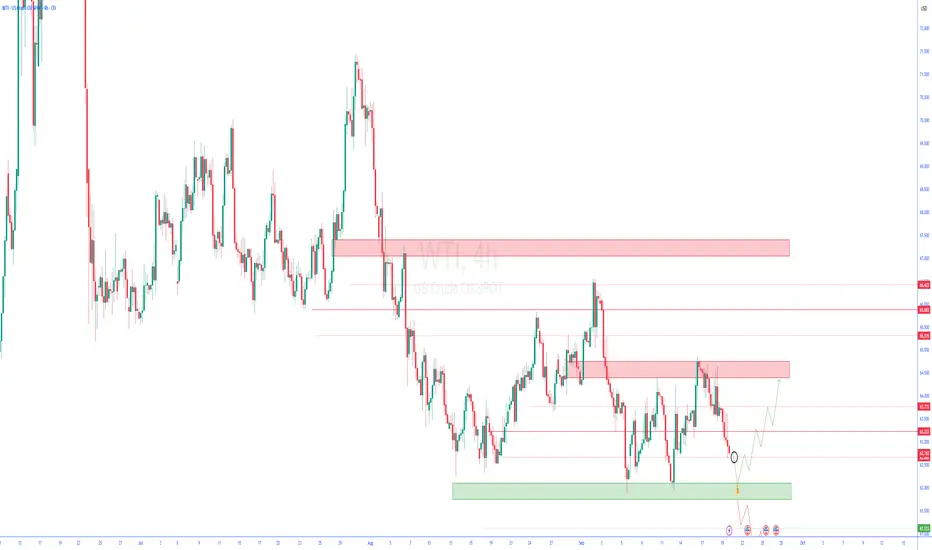
wti 4hTrading Perspectives for the Upcoming Week
In this series of analyses, we have reviewed short-term trading perspectives and outlooks.
As can be seen, in each analysis there is a significant support/resistance zone near the current asset price. The market’s reaction to or break of this level will determine the future price trend up to the next specified levels.
Important Note: The purpose of these trading perspectives is to examine key price levels and the market’s potential reactions to them. The analyses provided are by no means trading signals!
UsOil DailyWhile geopolitical tensions in the Middle East impact oil prices, technical charts often reveal the story before the headlines do.

Entry opportunity on oilThis “autonomous state,” which doesn’t seem to care about economic news or anything else, is now giving us an entry opportunity. If you insist on trading oil, the 61.500 range — which is a valid range — is a good buying opportunity. ✅

USOIL: Strong Bearish Sentiment! Short!
My dear friends,
Today we will analyse USOIL together☺️
The in-trend continuation seems likely as the current long-term trend appears to be strong, and price is holding below a key level of 62.657 So a bearish continuation seems plausible, targeting the next low. We should enter on confirmation, and place a stop-loss beyond the recent swing level.
❤️Sending you lots of Love and Hugs❤️
USOIL My Opinion! BUY!
My dear subscribers,
My technical analysis for USOIL s below:
The price is coiling around a solid key level - 62.35
Bias - Bullish
Technical Indicators: Pivot Points Low anticipates a potential price reversal.
Super trend shows a clear buy, giving a perfect indicators' convergence.
Goal - 63.12
About Used Indicators:
By the very nature of the supertrend indicator, it offers firm support and resistance levels for traders to enter and exit trades. Additionally, it also provides signals for setting stop losses
Disclosure: I am part of Trade Nation's Influencer program and receive a monthly fee for using their TradingView charts in my analysis.
———————————
WISH YOU ALL LUCK

Review the crude oil movement Let’s review the crude oil movement last week. WTI prices declined amid concerns over the U.S. economy and oversupply. Traders are still assessing the Fed’s remarks regarding further interest rate cuts.
In terms of price action, crude oil maintained a volatile downward trend. There was a brief rebound at one point, but the gains were eventually erased, and prices resumed their decline. The downtrend continued through Friday, yet the key support level of 62 remained unbroken. It is expected that crude oil will stage a rebound and go up in the coming week.
Daily-updated accurate signals are at your disposal. If you run into any problems while trading, these signals serve as a reliable reference—don’t hesitate to use them! I truly hope they bring you significant assistance

Oil Market Update📢 NFX TVC:USOIL Market Update
🛢 GBEBROKERS:USOIL
📊 ECONOMICS:USCOI EIA Crude Oil Inventories – Sep 17, 2025
Actual: -9.285M
Forecast: +1.400M
Previous: +3.939M
⚡ Huge bullish surprise – sharp drawdown vs forecast.
📍 Current Price: 64.3
Holding above 200-day SMA
Trading at key resistance, but zone already weakened from repeated tests.
🔀 Implication:
Given the bullish inventory print, I now lean towards Path B → liquidity push above 64.3 toward 65.0 (38.2% Fib level) before any meaningful bearish retracement.
⚠️ Keep in mind: ECONOMICS:USINTR decision still ahead → volatility risk.

Downtrend in oilCurrently, the oil trend is completely bearish, and as we expected, the price has bounced back from the RS FL range and is continuing its downward path.

USOIL (WTI Crude Oil) Intraday & Swing Outlook🛢️ USOIL (WTI Crude Oil) Forecast – Intraday & Swing Outlook 🚀📉
Asset Class: USOIL (SPOTCRUDE / WTI CASH)
Last Closing Price: $62.796
Date/Time: 20th Sept 2025 – 12:50 AM UTC+4
🔍 Market Context
Crude oil remains in a volatile zone as macro factors like OPEC+ policy, global demand recovery, and geopolitical risks continue to steer momentum. Traders must prepare for short squeezes, traps, and breakout plays this week.
📊 Technical Overview
Chart Theories Applied:
📈 Elliott Waves – corrective Phase B nearing end.
🔄 Wyckoff – signs of re-accumulation spotted.
🔺 Head & Shoulders (Inverse) – potential bullish reversal.
🔮 Gann Angles & Time Cycle – short-term resistance clustering near $64.50.
🛠️ Indicators
🔵 RSI (H1) → Neutral zone (48–52).
📏 VWAP Anchored → $62.20 (support pivot).
📉 EMA 20 / EMA 50 → Bullish cross on H4 confirmed.
🎯 Bollinger Bands → Expansion phase → Expect high volatility.
🕒 Timeframe Strategies
📌 Intraday (5M / 15M / 1H / 4H)
Buy Entry (Scalp): $62.20 – $62.50 🟢
TP1: $63.20 🎯
TP2: $63.85 🎯
SL: $61.80 ❌
Sell Entry (Scalp): $63.80 – $64.20 🔴
TP1: $63.00 🎯
TP2: $62.40 🎯
SL: $64.70 ❌
📌 Swing (Daily / Weekly)
Buy Zone: $61.50 – $62.00 🟢
Targets: $65.20 / $67.40 / $70.00 🎯
Stop Loss: $60.50 ❌
Sell Zone (Rejection): $67.40 – $68.00 🔴
Targets: $64.50 / $62.20 🎯
Stop Loss: $68.80 ❌
⚠️ Risk Management
Volatility expected due to Fed rate guidance & OPEC+ commentary.
Stick to 2–3% capital risk per trade.
Watch for bull/bear traps near breakout zones.
📌 Summary
Intraday: Range $62.20 – $64.20 ⚖️
Swing: Upside bias if $61.50 holds strong 💹
Key Resistance: $64.50 / $67.40
Key Support: $61.50 / $60.50
🔥 Bias: Short-term sideways → Medium-term bullish above $61.50.
For individuals seeking to enhance their trading abilities based on the analyses provided, I recommend exploring the mentoring program offered by Shunya Trade. (Website: shunya dot trade)
I would appreciate your feedback on this analysis, as it will serve as a valuable resource for future endeavors.
Sincerely,
Shunya.Trade
Website: shunya dot trade

USOIL SENDS CLEAR BULLISH SIGNALS|LONG
USOIL SIGNAL
Trade Direction: short
Entry Level: 62.36
Target Level: 63.32
Stop Loss: 61.72
RISK PROFILE
Risk level: medium
Suggested risk: 1%
Timeframe: 4h
Disclosure: I am part of Trade Nation's Influencer program and receive a monthly fee for using their TradingView charts in my analysis.
✅LIKE AND COMMENT MY IDEAS✅

CRUDE OIL Rebound Ahead! Buy!
Hello,Traders!
CRUDE OIL has been ranging
For a while now and the
Price is now about to
Retest the horizontal
Support level of 61.50$
From where a local
Bullish correction is
To be expected
Buy!
Comment and subscribe to help us grow!
Check out other forecasts below too!
Disclosure: I am part of Trade Nation's Influencer program and receive a monthly fee for using their TradingView charts in my analysis.

USOIL NEW OUTLOOK According to H1 analysis USOIL market running in side wave from last few days now market at support level you have greatest oppourtanity to buy from here is best for you thanks
TRADE AT YOUR OWN RISK
REGARD ALBERT
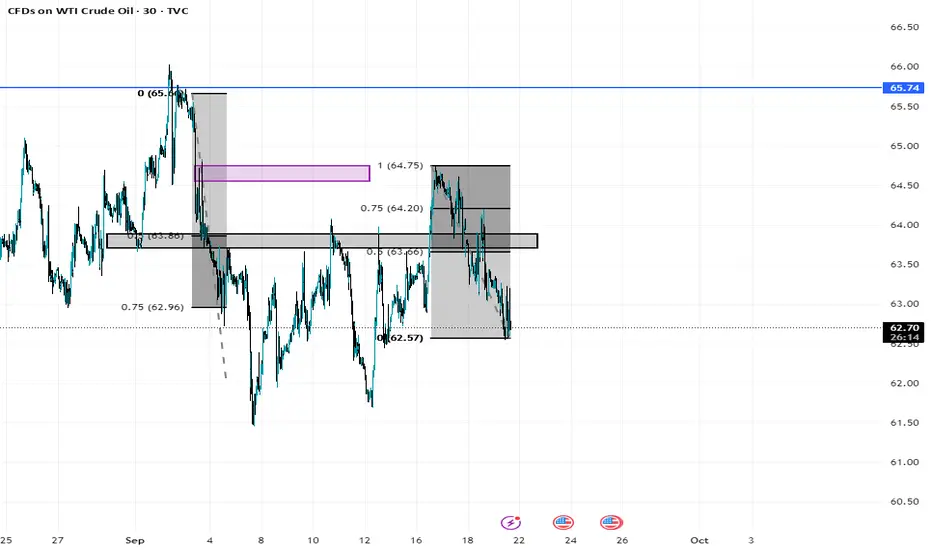
USOIL TREND ANALYSISUSOIL is in down trend for a long(30 minutes tf) time so the important areas are marked. When market reaches that marked zones, we will shift to smaller time frame and look for small trend shift once it happens we will go for the sell side trade.
OIL – Stuck in Range as Russian Supply Risks Counter OPEC+ PressOIL – OVERVIEW
Oil is on track for a modest weekly gain, but remains locked in a narrow range since early August. Bearish fundamentals—led by OPEC+’s accelerated output return—continue to cap upside potential.
However, lingering concerns over Russian supply risks following recent Ukrainian attacks on key infrastructure and Trump’s call for NATO allies to halt Russian oil purchases keep the market alert for potential spikes in volatility.
Technical Analysis
Crude maintains a bearish momentum while trading below 63.47 – 63.14, with downside targets at 61.83 and, if broken, 60.16.
A confirmed 4H close above 63.47 would shift momentum to bullish, opening a path toward 64.72 and 65.83.
Key Levels
Pivot: 63.14
Resistance: 63.47 – 64.72 – 65.83
Support: 61.83 – 60.16 – 58.70
Oil remains range-bound, with the 63.14–63.47 zone acting as a key decision area. A breakout will determine whether the next move favors a deeper pullback or a bullish reversal.

OIL Technical & Order Flow AnalysisOur analysis is based on a multi-timeframe top-down approach and fundamental analysis.
Based on our assessment, the price is expected to return to the monthly level.
DISCLAIMER: This analysis may change at any time without notice and is solely intended to assist traders in making independent investment decisions. Please note that this is a prediction, and I have no obligation to act on it, nor should you.
Please support our analysis with a boost or comment!

Oil price May rise!There may be a rise in oil price following the EIA Report on crude supply this week. Price is at extreme low levels and we could see a demand rise in oil from the current market price. A buy opportunity is envisaged .
