#OIL Buy@low Sell@highPast few days I am buying #crudeoil on every drip.
I am expecting the oil could be in a Bull run for the next few months.
#buy@low #sell@high
Simple trading strategy support & resistance
All trading methods will give only 49% or 51% - #money Management is the key
Your money management only decides your profit
#BTC #forex #supportortandresistance #tradinging #swingtradingstrategies #buy #sellll #EURUSD #goldd #niftyy #s&p #etf #qqq #iwm #future #options #longterm#buyy
@low #sell@high
Any trade money management is a tool to help you grow your portfolio.
Simple trading strategy support & resistance
All trading methods will give only 49% or 51% - #moneyManagement is the key
Your money management only decides your profit
#BTC #forex #supportortandresistance #tradinging #swingtradingstrategies #buy #sell #EURUSD #Gold #niftyy #s&p500 #etf #QQQ #IWM #future #options #longterm #XAUUSD #silver #USDCAD #BTCUSD
#BTC #forex #supportortandresistance #tradinging #swingtradingstrategies #buy #sellll #EURUSD #goldd #niftyy #s&p #etf #qqq #iwm #future #options #longterm #btc #forex #etf #option #money #earning #dollars #bitcoin,#btc,#spy,#forex,#bitcoin,#supportlevel,#RESISTANCELEVEL,#TESLA,#S&P500,#NVDIA,#APPLE,#AMAZON,#NIFTY,#META,#RSI,#STOCKMARKET,#SHAREMARKET,#GOLD,#OIL,#SILVER,#INTRADAY,#SWINGTRADE,#LONGTERM,#INVESTMENT,#SELL,#BUY,#BID,#ASK,#MARKET,#INVESTORS,#IWM,#OPTION,#FUTURES,#US,#ALIBABA,#CASH,#CASHFLOW
Trade ideas

us oilHI GUYS.
UPDATE ON CURRENT SITUATION
US OIL.
we failed to reach area of interest however i made buys 2 hours ago.
I expect sells wed, thur. Double top price.
after this correction we are going to dump crazily.


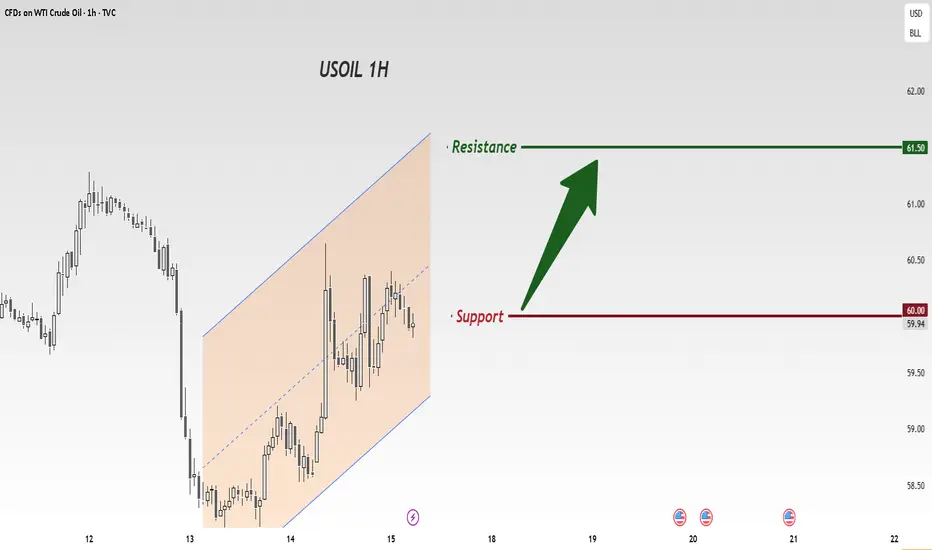
USOIL Is Bullish! Buy!
Please, check our technical outlook for USOIL.
Time Frame: 9h
Current Trend: Bullish
Sentiment: Oversold (based on 7-period RSI)
Forecast: Bullish
The market is trading around a solid horizontal structure 59.384.
The above observations make me that the market will inevitably achieve 61.007 level.
P.S
The term oversold refers to a condition where an asset has traded lower in price and has the potential for a price bounce.
Overbought refers to market scenarios where the instrument is traded considerably higher than its fair value. Overvaluation is caused by market sentiments when there is positive news.
Like and subscribe and comment my ideas if you enjoy them!

USOIL : daily review 17/11/2025Oil prices also slipped after Russia’s Novorossiysk port quickly resumed operations following a Ukrainian strike, removing a short-lived supply scare. Geopolitical tensions remain elevated, with notable examples including Iran’s seizure of a tanker and the ongoing US sanctions on Russia; however, rising global production remains the dominant force. Outages and disruptions across refining hubs have pushed margins higher; however, the broader trend suggests a well-supplied market heading into next year.
In addition, many traders don’t expect OPEC+ to cut production next year, even with a potential surplus on the horizon. The group is sticking to its market-share strategy unless demand collapses and prices drop sharply. Saudi Arabia and its partners have revived output despite weak prices, betting that oversupply remains manageable and that China can continue to absorb excess barrels.
On the technical side, the crude oil price found sufficient support around the $58 mark, which is a combination of the lower band of the Bollinger Bands and the 23.6% Fibonacci retracement level, and has since corrected to the upside. Although the moving averages are confirming an overall bearish trend in the market, the recent bullish correction could persist into the upcoming sessions and potentially retest the latest high around $61, if it manages to break above the psychological resistance of the round number at $60. The Stochastic oscillator is in neutral levels, indicating potential for the price to move either way in the short term. However, the overly contracted Bollinger Bands may limit price action in the short term, likely keeping the price within sideways action between $58 and $62 for now.
Disclaimer: The opinions in this article are personal to the writer and do not reflect those of Exness

BULLISH MOVEPrice is on retracement move to a supply zone. Lets expect a small bullish movement to the supply zone. But if not ready to risk lets wait for the price to reach supply zone and sell.

USOIL: Consolidation First, Breakout Next After crude oil plummeted last week to a low near 58.1, it rebounded on Friday and closed around 59.5, basically confirming a consolidating trend.
For this week, crude oil is expected to first trade in a low-range consolidation before assessing the potential for a unilateral move. Focus on the 58 level as support below and 62 as resistance above; trade within this range using a "buy low and sell high" strategy.
Go long around the 58.2 level.
Go short around the 61.8 level.
If the price breaks out of this range, then look for a unilateral trend to follow.
Core trading logic:The current crude oil market is in a balanced state of "relatively abundant supply + weak demand + macroeconomic uncertainty + technical fluctuations", with no clear trend direction. Therefore, a mixed strategy of "interval high selling and low buying + breakthrough confirmation for follow-up" is adopted. The focus is on the core range of $58 - $61. Buy at the support level and sell at the resistance level. At the same time, a follow-up position after a trend breakthrough is reserved to balance stability and flexibility.
Crude oil trading strategy
buy:60-60.5
tp:61-61.5
sl:59.5
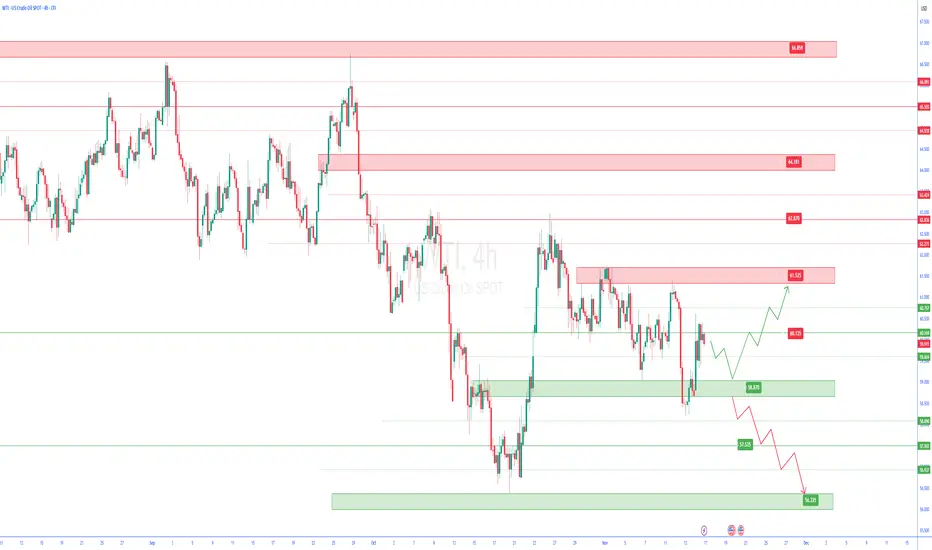
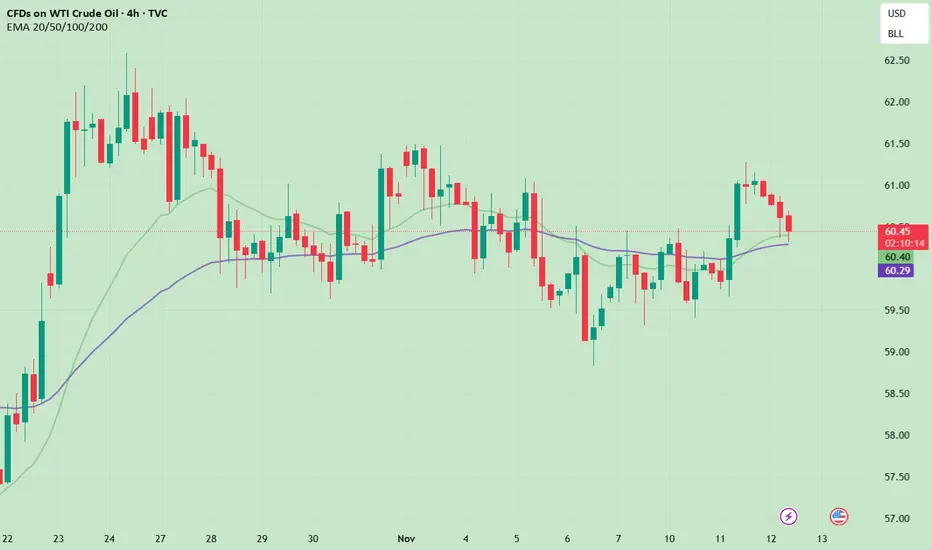
wti 4h🔹 Overall Outlook and Potential Price Movements
In the charts above, we have outlined the overall outlook and possible price movement paths.
As shown, each analysis highlights a key support or resistance zone near the current market price. The market’s reaction to these zones — whether a breakout or rejection — will likely determine the next direction of the price toward the specified levels.
⚠️ Important Note:
The purpose of these trading perspectives is to identify key upcoming price levels and assess potential market reactions. The provided analyses are not trading signals in any way.
✅ Recommendation for Use:
To make effective use of these analyses, it is advised to manually draw the marked zones on your chart. Then, on the 15-minute time frame, monitor the candlestick behavior and look for valid entry triggers before making any trading decisions.
How did crude oil take over and start rising?Rebalancing of Fed policy expectations, weakening of dollar suppression
The core inflation data in the US shows a downward trend. The probability of the Fed cutting interest rates in December remains above 60%, and overly hawkish expectations have been partially corrected. The US dollar index is experiencing pressure near the 100 mark, and the momentum of its previous strength has weakened, reducing its suppression effect on crude oil. Historical data indicates that the negative correlation between the US dollar index and crude oil prices is more significant in volatile markets. If the US dollar declines next week, it will provide liquidity support for the rebound of oil prices.
Next week, we will share the trading strategies for crude oil.
buy:59.50-59.70
tp:60.50-60.70
sl:59.95

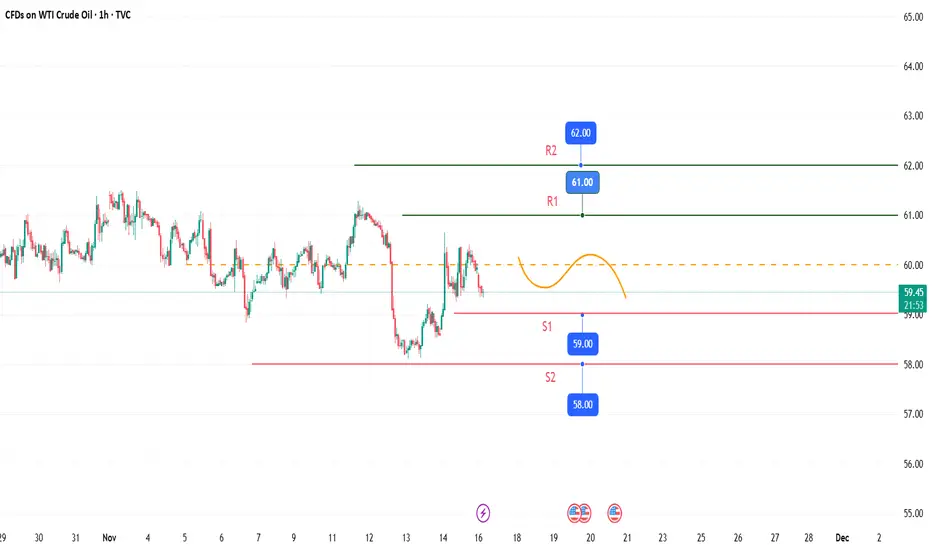
WTI Crude The Week Ahead Key Trading LevelsKey Support and Resistance Levels
Resistance Level 1: 6150
Resistance Level 2: 6210
Resistance Level 3: 6300
Support Level 1: 5936
Support Level 2: 5845
Support Level 3: 5777
This communication is for informational purposes only and should not be viewed as any form of recommendation as to a particular course of action or as investment advice. It is not intended as an offer or solicitation for the purchase or sale of any financial instrument or as an official confirmation of any transaction. Opinions, estimates and assumptions expressed herein are made as of the date of this communication and are subject to change without notice. This communication has been prepared based upon information, including market prices, data and other information, believed to be reliable; however, Trade Nation does not warrant its completeness or accuracy. All market prices and market data contained in or attached to this communication are indicative and subject to change without notice.

The bearish trend of crude oil has been establishedDownward revision of global crude oil demand growth expectations, weak terminal consumption
Both OPEC and IEA have lowered their 2025 demand growth expectations. IEA predicts that the annual demand will only increase by 700,000 barrels per day, the slowest growth rate since 2009. The average weekly supply of US crude oil products has decreased by 0.91% year-on-year, European diesel consumption remains sluggish, and the replenishment demand of core Asian consuming countries shows "short cycle, low intensity" characteristics, making it difficult to form a sustained support. Currently, the demand side of crude oil lacks clear growth momentum, and the mismatch between supply and demand has further intensified.
The effect of renewable energy substitution continues, squeezing the space for crude oil demand
Global wind power and photovoltaic installations continue to expand. European wind power output has returned to normal levels, and Asian photovoltaic new installations maintain high growth rates. The electricity supply gap has narrowed, leading to a reduction in crude oil replenishment demand. At the same time, the share of biofuels in the transportation sector has steadily increased, even with short-term cost fluctuations, the long-term substitution trend has not changed, further limiting the growth potential of crude oil demand.
Crude oil trading strategy
sell:58.45-58.55
tp:58.25-58.35
sl:58.15

USOIL - Bullish ReversalUSOIL has formed a double bottom with divergence and currently trading near its neckline. Buy stop entry on break of neckline.

Bearish USOIL: 58 at RiskUSOIL extended the previous session's decline today, showing an overall weak fluctuating downward trend. The core bearish factor of oversupply continues to weigh, with a lack of short-term rebound momentum.
On the indicator front, the 9-day EMA has crossed below the 20-day EMA, forming a short-term death cross signal, indicating that the downward trend is likely to continue. The 14-day RSI hovers around 40, remaining in a downward channel with no oversold rebound signals, suggesting that bears still hold the initiative and there is no large-scale entry of bottom-fishing funds.
In terms of resistance and support, short-term rebound resistance is concentrated at the pivot point of 59.28 and the 59.50-60 range. As a key integer level, failure to reclaim 60 will see bearish sentiment continue to spread. For support below, focus first on 55.7; if the 58 level is broken, a accelerated drop to this support level is highly likely.
Trading Strategy:
Buy 58 - 58.3
SL 58
TP 59 - 59.5 - 60
Sell 59.5 - 60
SL 60.5
TP 58.5 - 58 - 57.5

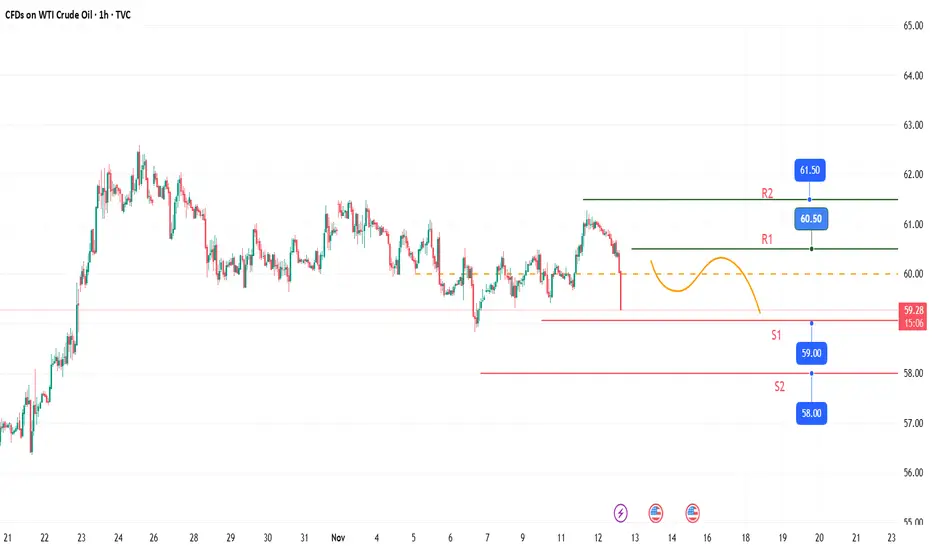
USOIL: Fluctuating declineCrude oil showed a trend of fluctuating decline today, breaking through key support levels, with a clear bearish dominance.
Key support below: In the short term, attention should be paid to the $59.00 integer mark. If this level is breached, oil prices may further drop to $58.00.
Resistance levels for rebound: If there is a technical rebound in oil prices, the first resistance level is at $60.50, and the second resistance level is at $61.50, with limited rebound space.
Trading Strategy:
Buy 59 - 59.5
SL 58.5
TP 60 - 60.5 - 61
Sell 60.5 - 61
SL 61.5
TP 59.1 - 58.5
USOIL | Breakout or Bull Trap? The Broader Case for Oil StrengthCrude oil appears to have broken above its short-term flag pattern — but is this the start of a continuation move, or just a false breakout? Several intermarket charts suggest the broader structure may still favour strength rather than exhaustion.
Technical Lens:
On the main USOIL chart, price has breached the upper bound of its descending flag after a steady base-building phase. The next few sessions will confirm whether this is a retest of the breakout or a failed move back inside the flag.
Chart-by-Chart Context:
1. Energy Sector ETF vs USOIL
The energy equity space has been outperforming crude itself. When energy stocks lead the underlying commodity, it often implies optimism about future earnings and renewed capital expenditure — a supportive sign for oil continuity.
2. Oil Volatility Index (OVX)
OVX has been steadily falling even as crude prices rise. This dynamic — higher prices with lower implied volatility — signals a healthy, stable uptrend driven by real demand rather than fear or short covering.
3. USOIL vs OVX Spread
The spread between crude and OVX continues to climb, indicating increasing price stability in the up-move. A rising spread historically accompanies sustained bullish phases.
4. USOIL vs Brent Oil
The spread between WTI and Brent remains in a descending structure, but with a potential breakout pending. If this breaks higher, it would suggest strengthening internal US demand — often a catalyst for follow-through in global crude benchmarks.
Scenarios:
Scenario A: If USOIL holds above the breakout zone → confirmation of a valid retest and potential continuation toward the upper resistance band.
Scenario B: If it slips back below the flag → false breakout risk, likely a short-term correction before broader trend direction resumes.
Takeaway:
Oil’s technical picture looks cautious but constructive. With energy equities leading, volatility compressing, and spreads hinting at underlying demand, the broader setup tilts toward stability — provided USOIL can sustain above its breakout zone.

Crude Oil Bullish at 60, US Session Strategy Update
After two days of gains, crude oil has regained the 60 mark, finally establishing a clear upward trend. Maintaining our previous view, crude oil is likely to continue its upward trend with fluctuations. We need to observe the strength and effectiveness of the rebound this week. Based on the current fluctuations, crude oil should continue to rise this week. In the short term, focus on the 60-60.3 buying level and patiently wait for the bullish upward space. Resistance remains around 62-62.5.5.
This advice is time-sensitive. I update my trading ideas and strategies daily. If you don't yet have a crude oil trading plan or idea and are seeking consistent and stable returns, please stay tuned.
Factors favoring the price of crude oil1.Short-term bullish support: Excess inventory was unexpectedly depleted
The latest API data shows that U.S. crude oil inventory dropped by 6.5 million barrels, far exceeding the market expectation of 1.3 million barrels. This represents the largest single-week decline in recent history, reflecting that refineries have entered the seasonal expansion phase, with accelerated crude oil processing and consumption, and the export demand remains resilient. This data directly alleviated market concerns about short-term oversupply, providing immediate support at the $60.90 level. From a structural perspective, gasoline inventory also showed a depleting trend, suggesting a marginal improvement in terminal consumption, and the short-term supply-demand balance leans towards a tight equilibrium.
2. Potential bullish factor: The overlooked black swan risk
The attack by Ukraine on Russian oil facilities is still ongoing. The Lukoil Volgograd refinery (accounting for 5% of Russia's total refining output) has been out of operation and the recovery progress is slow. Moreover, the United States has included all four major Russian oil giants in sanctions, and there is still potential supply disruption. Additionally, the latent conflict between Israel and Iran has not been fully resolved. The Strait of Hormuz, which is a transportation channel for 20% of the world's oil, always has safety hazards as an "invisible support" for oil prices. If the situation changes again, the geopolitical risk premium will quickly flow back.
Crude oil trading strategy
buy:60.5-60.8
tp:61.5-62
sl:59.5

US OIL - Long -65.00US OIL expected to hit the levels of 65.00 before falling further.
The support is taken above the levels of 61.00.
Major support at 59.70.

USOIL – Reversal Pattern in PlayRegarding USOIL, the last high has been broken, and the reversal pattern is now active.
I expect a downward correction toward the highlighted zone before continuing toward the pattern’s target shown on the chart.

Short-term rebound opportunities are emergingThe policy divergence of the Federal Reserve has emerged, and the expectation of a rate cut has not been completely reversed.
Although some Fed officials (Schmid, Logan) oppose a rate cut in December, Powell emphasized that "policies need to balance the risks of employment and inflation", and member Milan advocated for a significant rate cut, while Baumann expected another rate cut twice before the end of the year. There is a significant divergence between the dovish and hawkish factions within the Fed. The probability of a rate cut in December remains at around 50% in the market, and the few hawkish remarks have not completely negated the trend of easing. Coupled with the narrow range fluctuation of the US dollar index near 99.66 today, it has not broken through the key resistance of 99.75, and the strengthening momentum of the US dollar has weakened marginally. The valuation pressure of crude oil priced in US dollars has eased, creating conditions for a rebound.
Crude oil trading strategy
buy:59.3-59.6
tp:60-60.5
sl:59

USOIL: Accumulate bullish momentumFrom the daily chart perspective of crude oil, on a partial level, the current oscillating rhythm is a secondary consolidation. Judging from the primary and secondary rhythms, there is still room for a rebound and upward move in the trend. The MACD indicator remains below the zero axis, indicating that bullish momentum still needs to accumulate further. It is expected that after the medium-term trend of crude oil tests the low point and finds support, a rebound and upward movement is likely to form.
Buy 59 - 59.5
SL 58.5
TP 60 - 60.5 - 61
Sell 60.5 - 61
SL 61.5
TP 59.1 - 58.5
