Hellena | Oil (4H): LONG to resistance area 64.8.Colleagues, in fact, I have not changed the wave markup, but I have a slightly different view on the near-term price movement plan.
In the last forecast I emphasized that the target is the area of 58.9, but now it looks more likely that the completion of wave “C” in a complex correction (resistance

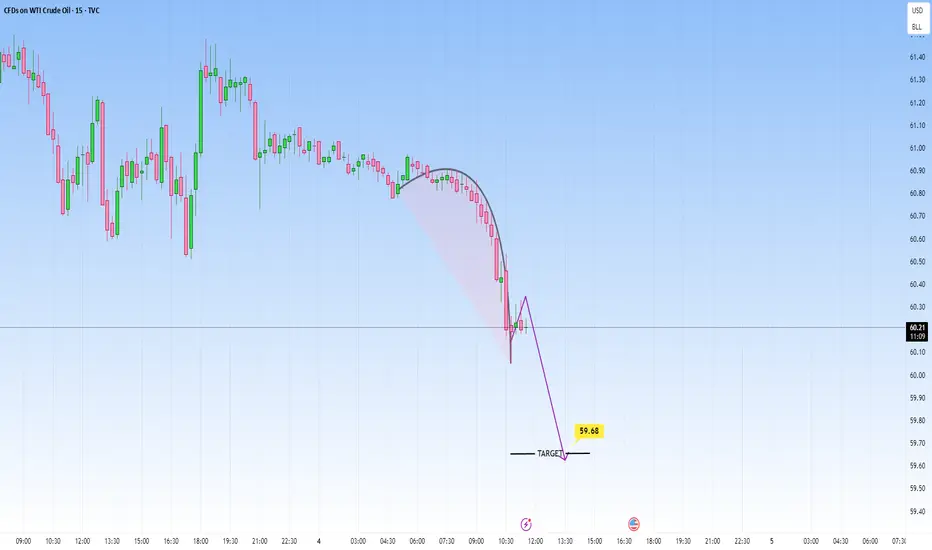
USOIL: Slow Continuation to the downside LikelyIn this short-term view, price is forming a rounded kind of top. The structure broke to the downside with more volume.
We could see another leg lower, targeting around 59.65.
US CRUDE OIL (WTI): Bullish Move from Key LevelI am quite pleased with how 📈USOIL reacted on a significant horizontal support level on a 4-hour time frame.
Following this test, the pair started to consolidate and form a horizontal range.
A breakout above the resistance of this range provided a strong bullish signal.
We are currently seeing a

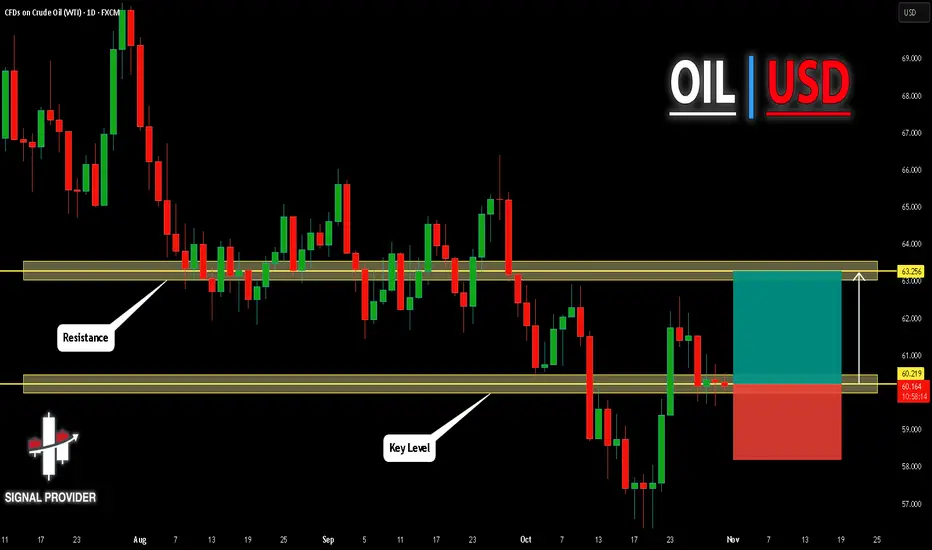
USOIL Is Very Bullish! Long!
Please, check our technical outlook for USOIL.
Time Frame: 1D
Current Trend: Bullish
Sentiment: Oversold (based on 7-period RSI)
Forecast: Bullish
The market is approaching a significant support area 60.219.
The underlined horizontal cluster clearly indicates a highly probable bullish movement
Hellena | Oil (4H): SHORT to support area of 59.00.Colleagues, the situation is complicated, but I still expect the price to renew the local low of 56.40.
It looks like the price is forming a complex compound correction (WXY) and I think that for now it is worth looking at the 59.00 area as the nearest most likely level.
Ideally, I would like to s

USOIL Symmetrical triangle buying from key support📊 USOIL Update (1H Timeframe)
🟢 Symmetrical Triangle Breakout Setup!
Price holding strong at the key support zone – $60.000 ✅
🎯 Technical Targets:
1️⃣ $60.800
2️⃣ $61.800
3️⃣ $62.400
🧭 Plan:
Looking for buying opportunities from the support zone as long as $60.000 holds.
⚠️ Risk Management is Ke

Bullish bounce off?WTI Oil (XTI/USD) has bounced off the pivot, which has been identified as a pullback suport and could potentially rise to the 1st resistance.
Pivot: 60.13
1st Support: 58.86
1st Resistance: 63.19
Disclaimer:
The above opinions given constitute general market commentary, and do not constitute the

Expecting decrease in supply by end of yearBased on the current OPEC's report (October 2025) there is an increase in supply.
The supply will be reduced by the end of year.
In relation to the MFE and MAE we are getting closer to MAE.
We're heading to a discount price (ICT)
Add long position below 44USD

Crude oil barrel priced at $300?Don't be surprised if we eventually see the crude oil barrel priced at $300.
I sure won't!

WTI OIL 1D MA50 rejection. Sell Signal.Last time (October 14, see chart below) we took a look on WTI Oil (USOIL), we gave a Buy Signal right at the bottom of its 3-month Channel Down, which eventually hit our 62.00 Target:
This time we have a Sell Signal as the price and the Channel's Bullish Leg got rejected on its 1D MA50 (blue tr

See all ideas
Displays a symbol's price movements over previous years to identify recurring trends.