COPPER XCUUSD Copper is a versatile industrial metal with a wide range of essential applications due to its excellent electrical and thermal conductivity, malleability, corrosion resistance, and antimicrobial properties.
Key Industrial Applications of Copper:
Electrical Wiring and Electronics:
Copper's high electrical conductivity makes it the metal of choice for electrical wiring in residential, commercial, and industrial buildings.
It is extensively used in electronic devices, printed circuit boards (PCBs), connectors, and terminals.
Copper wiring is critical in power generation, transmission, and distribution systems.
Construction and Architecture:
Copper is used for roofing, cladding, gutters, and downspouts due to its durability, corrosion resistance, and aesthetic appeal.
Its antimicrobial properties make it suitable for plumbing and water piping systems, helping prevent bacterial contamination.
Renewable Energy and Transportation:
Copper plays a pivotal role in electric vehicles (EVs), used in batteries, electric motors, and wiring harnesses.
Renewable energy technologies such as solar panels and wind turbines use copper for electrical components and power transmission.
Heating and Cooling Systems:
Due to its high thermal conductivity, copper is widely used in heat exchangers, air conditioning units, radiators, and refrigeration systems.
Medical Applications:
Copper’s antimicrobial properties are utilized in medical devices and hospital environments for infection control.
Industrial Machinery and Manufacturing:
Copper and its alloys (brass, bronze) are used to manufacture tools, bearing components, and machinery parts due to their strength and resistance to wear.
Other Uses:
Copper is used in musical instruments, coins, jewelry, and artistic applications due to its deformability and appealing color.
#XCUUSD #DXY #US10Y
Trade ideas

CopperXCUUSD
- Bearish Channel as an corrective pattern in Short Time Frame
- Change of Characteristics
- Completed " 12345 " Impulsive Waves and " AB " Corrective Waves
- RSI - Divergence
- Support Level

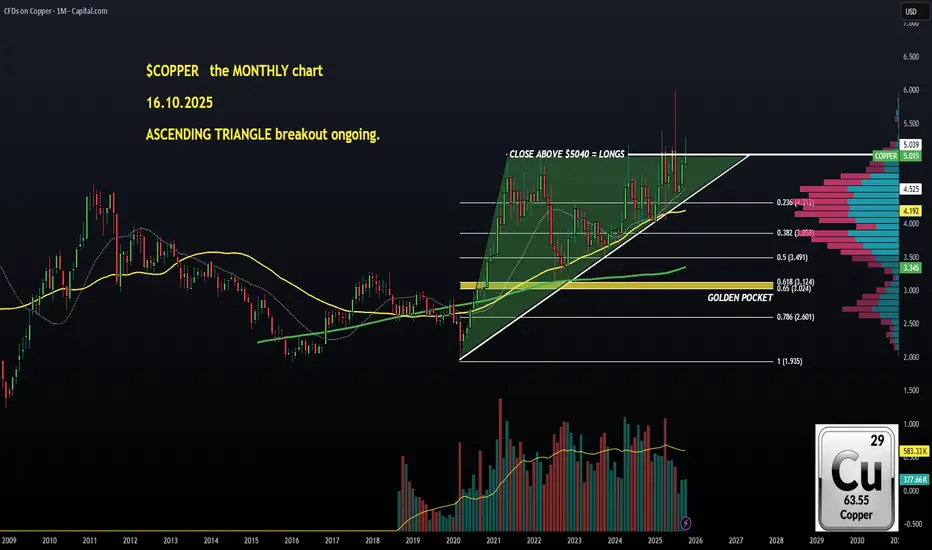
$COPPER (weekly): ASCENDING TRIANGLE breakout attempt ($8 soon?)I posted about PEPPERSTONE:ALUMINIUM last night, already running and 2%+ up. And there is another candidate for a LONG very soon, $COPPER.
These industrial metals either have already started mooning or are just about too. Huge shortages of the actual copper and these are predicted to get worse, for years to come (attached graph).
Less supply, higher prices. And the trade war only helps the prices, as evidenced on my MONTHLY chart.
Very simple chart, an ASCENDING TRIANGLE breakout attempt, close a strong candle above $5.05, and I'm callling for $8+.
Being in metals also provides the best kind of diversification that a serious investor-trader type like myself can ever wish for.
So, LONG above $5.05
STOP LOSS: below 50 SMA (yellow at $4.19 atm)
TP: 50% around $8 (just a rough plan for now)
👽💙
Copper Long 5/6 Special.Fundamental: 5 | Technical: 6 StacksCAPITALCOM:COPPER COPPER We trade with the odds stacked in our favour. That's confluence. Fundamental: 5 | Technical: 6 Stacks. That was we like to call the perfect trade. No such thing however when the stars align we pull the trigger. Copper supported by infrastructure demand and tight supply; technicals show sustained strength near
$4.90.

CopperXCUUSD
- Bullish Channel as an corrective pattern in Short Time Frame
- Buy Side Liquidity
- Order Block
- Completed " 12345 " Impulsive Waves
- Fair Value Gap

COPPER (HG) – Institutional Outlook📊 Macro & COT Context
The latest COT report shows a +3% net increase in buying pressure from non-commercials, supporting a structural long bias. Asset managers keep adding longs while shorts remain stable, suggesting accumulation behavior.
📈 Technical Structure
Breakout & acceptance confirmed above prior range.
Current retest of the 75% discount VAL demand zone aligns with institutional footprints.
Demand cluster at $4.50 acts as the key defense line.
🎯 Projected Scenario
Primary Bias (Long): Continuation to higher premium levels if demand holds.
Invalidation: A clean break below the demand zone would invalidate the long setup.
Extension: If institutions keep absorbing supply, price could reach external premium zones.
🛠️ Confirmation & Monitoring
Monitor COT weekly updates for sustained long pressure.
Check reaction at the demand zone for institutional absorption signals.

CopperXCUUSD
- Impulse Correction
- Fibonacci Level - 61.80 / 78.60%
- Completed " 12 " Impulsive Waves
- Fair Value Gap
- Order Block

Financial Market CoverageIntroduction
Financial markets are the backbone of modern economies, providing platforms where capital is allocated, risks are managed, and liquidity is ensured. They are complex ecosystems that bring together borrowers, lenders, investors, and intermediaries, facilitating the movement of funds across time, geography, and sectors. Covering financial markets effectively is essential for investors, policymakers, analysts, and financial institutions because it enables informed decision-making, risk assessment, and strategic planning.
Financial market coverage refers to the scope, depth, and quality of information, analysis, and reporting on various aspects of financial markets. It encompasses price movements, trading volumes, market trends, regulatory developments, macroeconomic indicators, and company-specific news. A robust financial market coverage system integrates real-time data, expert insights, historical trends, and predictive analytics to guide stakeholders in navigating financial ecosystems efficiently.
This discussion explores financial market coverage in detail, including its types, methods, participants, technological frameworks, challenges, and global implications.
1. Importance of Financial Market Coverage
Financial market coverage is critical because markets are highly dynamic, influenced by an array of global and local factors. Timely, accurate, and comprehensive coverage helps participants make decisions that affect capital allocation, portfolio performance, and risk management. Some key reasons for its importance include:
a) Decision-Making Support
Investors, fund managers, and corporate treasurers rely on detailed market coverage to make strategic decisions. For example, knowledge about equity price trends, interest rate movements, and currency fluctuations enables traders to optimize portfolios and hedge risks effectively.
b) Transparency and Market Efficiency
Comprehensive coverage promotes transparency by providing access to information that reduces information asymmetry. When market participants have access to the same data, markets function more efficiently, minimizing opportunities for unfair advantages and speculative anomalies.
c) Regulatory Compliance
Financial institutions operate under strict regulatory frameworks that require monitoring market developments, reporting trades, and managing systemic risk. Coverage ensures compliance with local and international regulations, such as those imposed by the Securities and Exchange Commission (SEC), the Financial Conduct Authority (FCA), and the Reserve Bank of India (RBI).
d) Risk Management
Understanding market dynamics allows participants to identify potential risks, including credit, market, operational, and liquidity risks. Financial market coverage equips institutions with analytical tools to predict volatility, assess asset correlations, and implement hedging strategies.
2. Types of Financial Market Coverage
Financial market coverage can be categorized based on the types of markets, instruments, and analysis it encompasses. Broadly, it includes:
a) Equity Market Coverage
Equity markets, or stock markets, represent ownership in publicly traded companies. Coverage in this domain includes:
Stock Prices: Real-time tracking of share prices, indices, and performance metrics.
Corporate Announcements: Earnings releases, dividends, mergers and acquisitions, share buybacks.
Market Trends: Sector performance, market capitalization trends, and liquidity analysis.
Technical Analysis: Charts, moving averages, support/resistance levels, and trading signals.
Equity market coverage is critical for traders, portfolio managers, and retail investors seeking growth opportunities or risk-adjusted returns.
b) Fixed Income Market Coverage
The fixed income market deals with debt instruments like government bonds, corporate bonds, and treasury bills. Coverage focuses on:
Interest Rate Movements: Central bank policies, yield curves, and macroeconomic indicators.
Credit Ratings: Bond rating changes, defaults, and market perception.
Liquidity Metrics: Trading volumes, bid-ask spreads, and market depth.
Fixed income coverage is vital for risk-averse investors, pension funds, insurance companies, and sovereign wealth funds.
c) Derivatives and Commodities Coverage
Derivatives markets, including futures, options, and swaps, allow hedging and speculation. Commodities markets cover energy, metals, and agricultural products. Coverage involves:
Price Movements: Spot, forward, and futures prices.
Volatility Indices: Implied volatility and Greeks for options.
Supply-Demand Dynamics: Inventory levels, production forecasts, geopolitical events.
Traders, hedgers, and commodity producers depend heavily on real-time, predictive coverage for risk management and trading strategies.
d) Foreign Exchange (Forex) Market Coverage
Forex markets facilitate currency conversion for trade, investment, and speculation. Coverage includes:
Exchange Rates: Spot, forward, and cross-currency rates.
Economic Indicators: Inflation, GDP growth, trade balances, interest rate differentials.
Geopolitical Events: Elections, trade wars, and central bank interventions.
Forex market coverage is critical for multinational corporations, banks, import-export businesses, and currency traders.
e) Alternative Investments Coverage
Alternative investments include private equity, venture capital, hedge funds, and real estate. Coverage focuses on:
Fund Performance: Returns, risk-adjusted metrics, and liquidity.
Market Trends: IPOs, M&A activity, and private fundraising.
Regulatory Developments: Taxation, compliance, and disclosure requirements.
Investors with high-risk tolerance or those seeking diversification beyond traditional assets rely on alternative investment coverage.
3. Channels of Financial Market Coverage
Financial market coverage is delivered through multiple channels that combine data dissemination, expert analysis, and technology:
a) Financial News Media
Traditional news outlets and specialized financial channels provide real-time news and insights. Examples include Bloomberg, CNBC, Reuters, and The Economic Times. Coverage here is typically broad, summarizing macroeconomic developments, market sentiment, and corporate news.
b) Analytical Platforms
Platforms like FactSet, Morningstar, and TradingView provide in-depth analytics, including historical data, performance ratios, and technical indicators. They allow investors to customize dashboards, run scenario analyses, and generate predictive models.
c) Brokerage and Trading Platforms
Brokerages provide market coverage integrated with trading functionalities. Real-time market data, order book depth, and price alerts allow traders to respond immediately to market movements. Many platforms also include AI-driven insights and automated trading strategies.
d) Social Media and Alternative Data Sources
Social media channels like Twitter, LinkedIn, and specialized investor communities provide sentiment analysis and early warnings about market developments. Alternative data sources include satellite imagery, web traffic data, credit card spending patterns, and ESG ratings. These data points provide unconventional insights into market trends.
e) Regulatory and Exchange Publications
Stock exchanges, central banks, and regulatory authorities provide official releases, circulars, and statistical reports. These documents are critical for compliance and understanding systemic risk. For example, the Reserve Bank of India publishes weekly forex reserves, monetary policy updates, and financial stability reports.
4. Technological Frameworks in Market Coverage
The efficiency of financial market coverage has improved drastically due to advancements in technology. Key components include:
a) Real-Time Data Processing
High-frequency trading and algorithmic strategies rely on instantaneous market data. Technologies like streaming APIs, cloud computing, and data lakes allow real-time aggregation, processing, and dissemination of market information.
b) Artificial Intelligence and Machine Learning
AI and ML algorithms analyze historical data, predict trends, and detect anomalies. Predictive models help portfolio managers forecast price movements, volatility, and macroeconomic shocks. Sentiment analysis from news and social media feeds also informs market forecasts.
c) Blockchain and Distributed Ledger Technology
Blockchain enhances transparency and reduces settlement risk in financial markets. Coverage of blockchain-based assets, cryptocurrencies, and tokenized securities requires specialized analytical tools capable of monitoring decentralized networks and smart contracts.
d) Data Visualization and Analytics
Advanced visualization tools transform raw data into actionable insights. Interactive charts, heat maps, and dashboards enable investors to grasp complex market patterns quickly. These tools are increasingly integrated into trading platforms and investment research applications.
5. Participants in Financial Market Coverage
Effective coverage involves a wide array of participants, each contributing to data collection, analysis, and dissemination:
a) Market Analysts and Research Firms
Analysts produce reports on market conditions, company performance, and economic indicators. Investment banks, consultancy firms, and independent research houses provide detailed insights for institutional and retail clients.
b) Financial Journalists
Journalists track news, interview industry experts, and report market-moving events. Their role is critical in shaping investor perception and ensuring timely dissemination of relevant information.
c) Data Providers and Aggregators
Companies like Bloomberg, Refinitiv, and S&P Global aggregate and verify massive amounts of financial data. Their coverage ensures accuracy, timeliness, and accessibility.
d) Regulators and Exchanges
Exchanges provide trading data, while regulators ensure that disclosures and reporting adhere to compliance standards. This dual role maintains market integrity and reduces systemic risk.
e) Retail and Institutional Investors
Investors themselves contribute to coverage by providing market sentiment through trading activities, surveys, and feedback. Platforms increasingly incorporate user behavior into predictive analytics.
6. Challenges in Financial Market Coverage
Despite technological advancements, financial market coverage faces several challenges:
a) Information Overload
The sheer volume of data generated daily can overwhelm analysts and investors. Distinguishing between signal and noise is critical for effective decision-making.
b) Data Accuracy and Reliability
Inaccurate or delayed data can lead to poor investment decisions. Ensuring data integrity through verification and cross-checking is essential.
c) Market Volatility
Sudden macroeconomic shocks, geopolitical events, or corporate scandals can render predictive models ineffective. Coverage must adapt rapidly to changing conditions.
d) Regulatory Complexities
Global markets operate under diverse regulations. Coverage must consider cross-border compliance, taxation policies, and disclosure requirements to avoid misinterpretation.
e) Cybersecurity and Data Privacy
As market coverage relies heavily on digital platforms, protecting sensitive financial data from cyber threats is paramount.
7. Global Perspectives and Integration
Financial markets are increasingly interconnected, requiring integrated coverage across geographies. Global investors monitor multiple exchanges, currencies, and commodities simultaneously. For example:
Cross-Market Correlations: Movements in the U.S. stock market can influence emerging markets, necessitating synchronized coverage.
Currency and Commodity Linkages: Oil price fluctuations can impact forex rates and equities, highlighting the need for integrated coverage systems.
Global Macroeconomic Events: Trade agreements, sanctions, and geopolitical crises require real-time, multi-market analysis.
Integrated coverage allows institutions to optimize asset allocation, hedge risks, and exploit arbitrage opportunities globally.
8. Future Trends in Financial Market Coverage
Financial market coverage is evolving rapidly due to technological, regulatory, and market-driven factors:
a) AI-Driven Predictive Analytics
AI will increasingly predict market trends, risk exposures, and sentiment-driven price movements with high accuracy.
b) Integration of ESG Data
Environmental, Social, and Governance (ESG) factors are becoming central to investment decisions. Coverage will include sustainability metrics and ESG ratings.
c) Expansion of Alternative Data
Non-traditional data sources such as social media sentiment, satellite imagery, and IoT device metrics will enhance market intelligence.
d) Personalized Coverage
AI-driven personalization will allow investors to receive coverage tailored to their portfolio preferences, risk appetite, and investment horizon.
e) Blockchain Transparency
Blockchain integration will provide immutable, real-time transaction data, enhancing trust and reducing settlement risk.
Conclusion
Financial market coverage is a cornerstone of modern finance. It encompasses the collection, analysis, and dissemination of data across multiple asset classes, markets, and geographies. Effective coverage supports decision-making, ensures transparency, facilitates risk management, and enables compliance with regulatory standards. With technological innovations like AI, blockchain, and big data analytics, market coverage is becoming faster, more accurate, and more comprehensive than ever before.
As financial markets continue to grow in complexity and global interconnection, the need for precise, timely, and insightful market coverage will only increase. Investors, institutions, and policymakers who harness high-quality coverage gain a critical edge in navigating the uncertainties of financial markets while optimizing opportunities for growth, diversification, and risk mitigation.
copper / gold and btc top circleCopper/gold ratio and BTC forming "top circle" peaks, signaling potential reversals. High ratio reflects economic strength; BTC's rounded top with overbought RSI suggests correction. Monitor volume, support levels.

Copper – Gearing Up for Higher LevelsAs long as Copper continues to hold above the $4.00 handle, the structure favors continuation to the upside. A clean break of $5.00 sets the stage for a strong bullish leg, with medium-term targets around $7.40 and, eventually, the possibility of Copper extending into double digits above $10.
> Key Levels:
Major support: $4.00 – $4.20 zone
Resistance / breakout level: $5.00
TP1: $7.39
TP2: $11.04
Beyond the chart, the future demand outlook for Copper remains extremely strong. With accelerating trends in electrification, renewable energy, EV adoption, and global infrastructure expansion, Copper is set to play a critical role in the next decade. This positions the metal as not just a strong technical play, but also a strategic long-term investment.
TL;DR
Copper is building momentum technically, while future demand drivers add strong tailwinds. Above $5, the path toward $7+ and potentially $10+ becomes increasingly realistic.

CopperXCUUSD
- Completed " 12345 " Impulsive Waves
- Break of Structure
- Falling Wedge as an corrective pattern in Short Time Frame
- Fair Value Gap ( FVG )
- Change of Characteristics

DOUBLE PATTERN:Cup and TriangleHello Traders,
All the eyes now on the next leg for the copper if Trump did not Finalize the Tariffs copper will go back to at least the bottom again 3.4 3.1 as every one kept loading up for the imports now the states is overloaded with loads of materials and minerals imagine what could happened if he didn't sign up this Tariffs on the mineral! they will be selling it for so cheap to cover the losses dramatically same like what happened with the oil its a commodity right !that's one scenario, the other one is every thing move as planned and the copper get back to the bottom of the triangle and shoot straight up so lets see what could happed I'm in short for now good luck, kindly support my idea if you like and make your decisions based on your research

Copper | From Tariff Fireworks to Gravity’s Pull at $4.00/lbCopper’s July spike quickly reversed as tariff fears unwound—29 Jul saw risk-off positioning, followed by the 30–31 Jul announcement that duties would target copper products, not refined cathode. This erased the U.S. premium and drove an 18–20% drop.
Since then price has consolidated in a corrective channel that resembles a bear flag. With stochastics rolling over and momentum still pointing lower, the setup leans toward a continuation leg, with bias for a retest of the $4.00/lb zone.

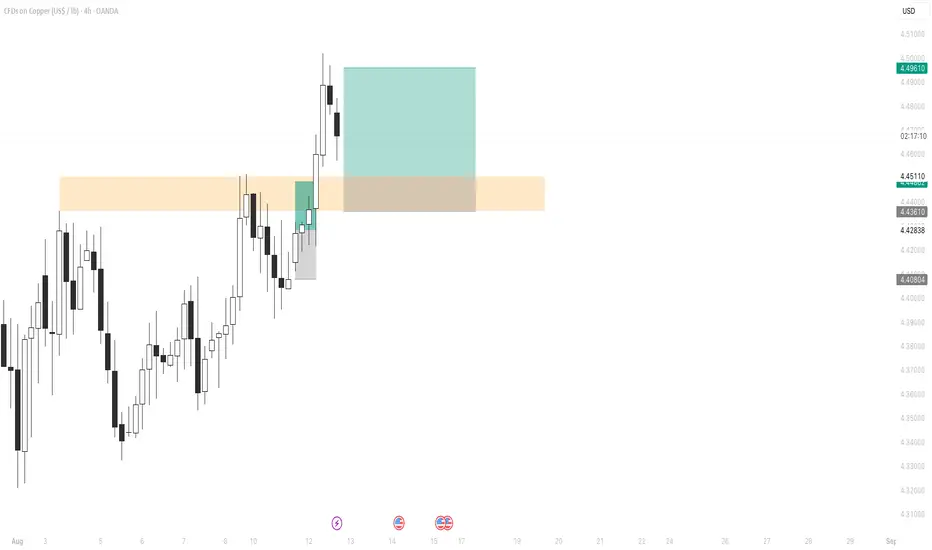
Bullish Daily Bias We can see copper is currently in a bullish daily bias. H4 is in an internal bearish pullback towards H4/D demand zone.
Anticipate to take trades on M15 after a CISD and pullback into a bullish FVG and target the daily HIGHs and beyond

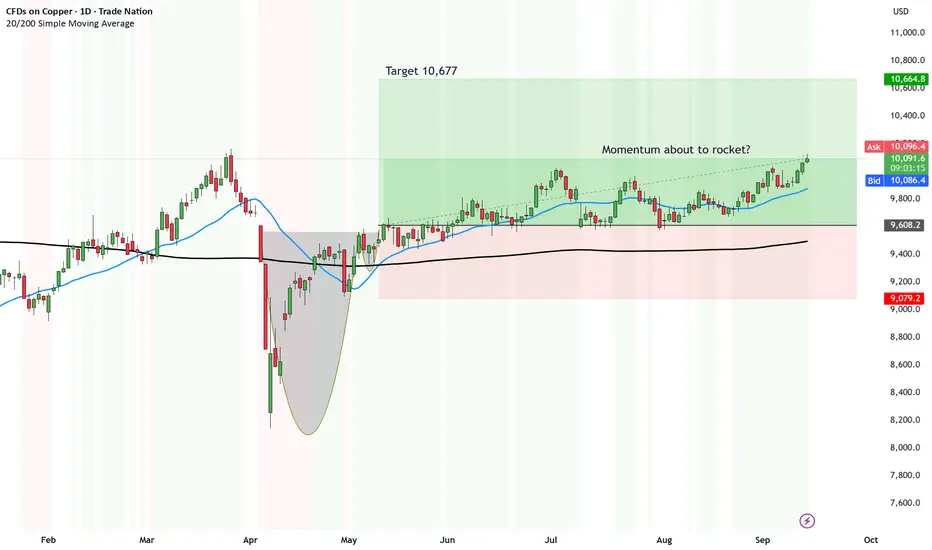
UPDATE: Copper slow, steady and finally ready to rocketIt's been a laborious trade.
Just been moving sideways slowly.
But now the price is breaking above the 10,051 mark finally and the momentum is leaning towards further upside.
We still have 10,677 on the cards and will continue updating accordingly.
Also, you can draw a rectangle formation, for the price to break above.
Then it's a whole new chart pattern.
Disclosure: I am part of Trade Nation's Influencer program and receive a monthly fee for using their TradingView charts in my analysis.
XCUUSD ShortThe XCUUSD appears poised to decline from the mid-golden zone around the 1.276 Fibonacci level, as indicated by the extended Fibonacci tool.

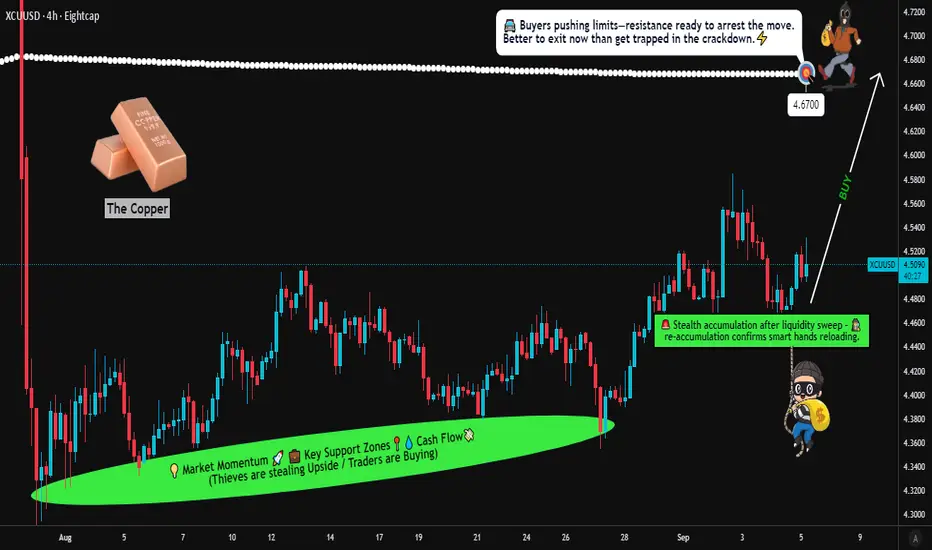
Copper vs Dollar | Institutional vs Retail Sentiment Analysis🔥 XCU/USD – Copper vs U.S Dollar | Thief Money-Making Plan (Swing/Scalping Trade)
🎯 Plan & Thief Entry Style
Bias: Bullish ✅ (Re-Accumulation Buy Setup)
Entry Style: Thief strategy = multiple limit order layers 🧩
Suggested Layers: (4.4600) 🟢 | (4.4700) 🟢 | (4.4800) 🟢 | (4.4900) 🟢 | (4.5000) 🟢
You can always increase limit layers depending on your own strategy.
Stop Loss (Thief SL): 4.4200 ⚠️
Ladies & Gentlemen (Thief OG’s) — always adjust SL to your own plan & risk appetite.
Target Zone: 4.6700 🎯
Resistance + overbought zone + possible trap → steal the money & escape! 🏃💰
📊 XCU/USD Market Snapshot (Copper vs U.S Dollar) – Sept 5, 2025
Real-Time Change: -0.8% 🔻
Retail Sentiment: 45% Long 😊 | 55% Short 😟
Institutional Sentiment: 60% Long 🚀 | 40% Short 🛑
➡️ Retail leaning bearish, while institutions show cautious optimism.
😨💰 Fear & Greed Index
Score: 48/100 (Neutral) ⚖️
Market mood balanced → no extreme fear/greed at the moment.
📊 Fundamental Score – 6/10
Stable global copper demand ✅
Risks: US economic slowdown ❌ & weaker China industrial output ⚙️
Key Watch: industrial production data + trade policy shifts
🌍 Macro Score – 5.5/10
US Dollar strength 🦅
Global PMI data + US jobs report 🏭
Tariff talks & supply chain risks add uncertainty
🐂🐻 Overall Market Outlook
Neutral ➡️ Slightly Bullish ⚖️➡️🚀
Short-term pressure from USD strength 📉
Long-term supported by institutional buying & steady industrial demand 🏗️
Watch: US Nonfarm Payrolls + China economic updates 📡
🔎 Quick Take – Why This Thief Plan?
Copper is stable but under macro pressure.
Institutional flow is bullish compared to retail → signal of hidden strength.
Neutral sentiment = less volatility now, but data events may unlock momentum.
Swing/Scalp opportunities exist with layered buy entries → thief escape at 4.6700! 💰
📌 Related Pairs to Watch
OANDA:XAUUSD (Gold)
OANDA:XAGUSD (Silver)
PEPPERSTONE:USDX (Dollar Index)
$CLUSD (Crude Oil)
✨ “If you find value in my analysis, a 👍 and 🚀 boost is much appreciated — it helps me share more setups with the community!”
#Copper #XCUUSD #Metals #Commodities #TradingView #SwingTrade #Scalping #Forex #ThiefStrategy #Layering #CommoditiesTrading #XAUUSD #XAGUSD #USDIndex #CrudeOil
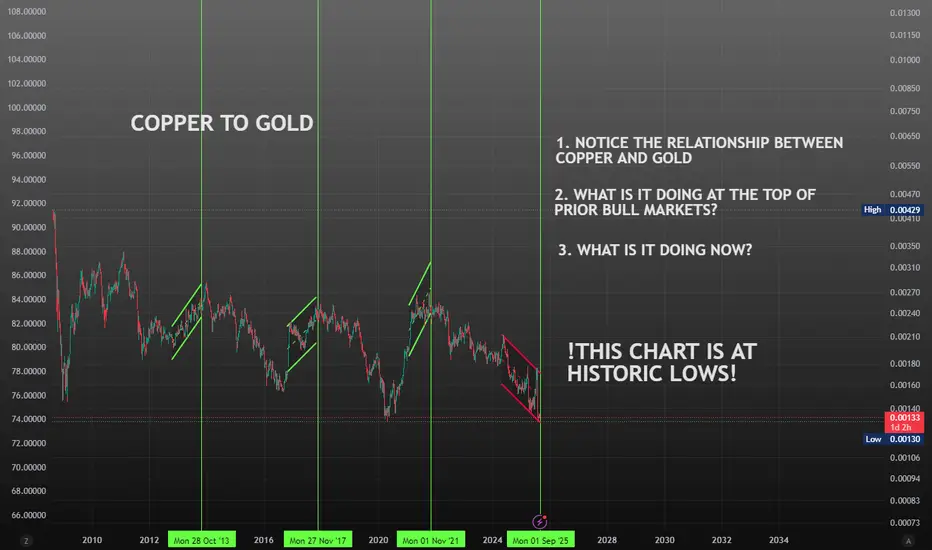
Copper to Gold in context of BTC Bull TopsCheck out how Copper performs versus gold when the previous bull markets peaked. Decide on your own if it is worth considering this valuation in relation to BTC cycles.
COPPER ~ TECHNICAL. 2H.Exiting this current channel may be accompanied by a significant price change...
So, we may have an eye on this after we buy or sell. but strongly.

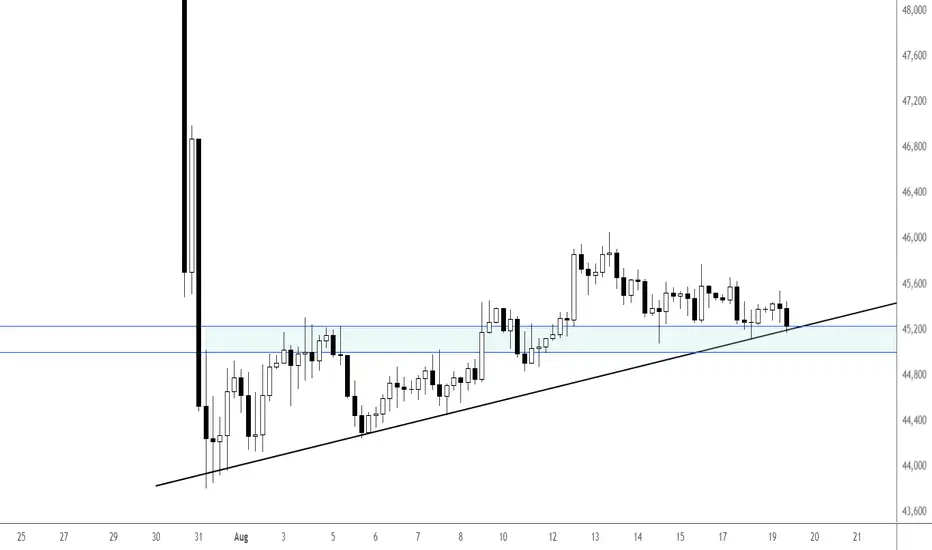
Copper testing bullish trend lineWith copper prices easing over the last few days, it has now reached a key short-term support area in the shaded region. Here a bullish trend line meets prior support/resistance range. Can we see a bounce here today? Or are we inside a bear flag pattern? Either way, we will soon find out, and then one can trade copper accordingly. We prefer the long side give a positive long-term macro backdrop for copper.
Fawad Razaqzada, market analyst with FOREX.com
Copper on a possible breakout retest, resumption of a half-cycleCopper on a possible breakout retest, resumption of a half-cycle low.
28 days of what appears to be a weekly and daily cycle low. There could be significant gains until the end of October.
Entry: 9.984
Stop Loss (SL): 8.520
(The chart may look slightly different for you depending on the instrument you use.)

XCUUSD Break & RetestPrice has broken previous Higher High, and I am expecting it to retest previous level and continue the bullish trend
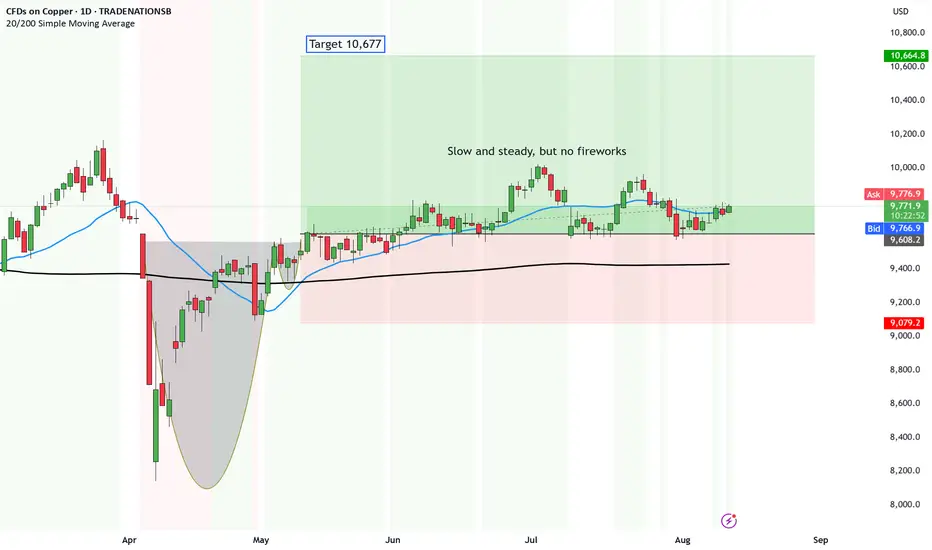
Slow and steady wins the race for Copper - yea right!In June I started a Target for Copper at 10,677.
THe result - nowhere slowly.
Now if one was holding this trade, it would have been costly.
Not only opportunity cost but also actual daily interest charges...
So why is Copper moving nowhere slowly?
🏭 Oversupply outweighs demand
📉 Tariff hype fizzled out
🌍 U.S. & global prices misaligned
🇨🇳 China demand cooling
⏳ Market in wait-and-see mode
The target is still on but it can take a while and you might need to read Vogue or something.
Disclosure: I am part of Trade Nation's Influencer program and receive a monthly fee for using their TradingView charts in my analysis.