Mastercard Incorporated Class A
No trades
Trade ideas

MA Gann LevelsUse the low of 4.20; use the high of 30.33; project out from there and these critical levels present themselves
acknowledge the strength of these gann levels
manage your own risk
gl hf
xoxo
snoop

38.2% & POSSIBLE 61.8% Retracement SHORT GWAVE38.2% & POSSIBLE 61.8% Retracement SHORT GWAVE.
FIB Retracement Percentage is calculated in a Higher Cartesian and or Euclidean Dimension.
PLEASE ALWAYS WAIT FOR STOCHASTIC CONFIRMATION!!! THANK


$MA More Wedges Breaking down (BEARISH)Trash is trash unless otherwise stated (Untold law of Newton, *paraphrasing).
They keep pumping it with slight marginal new highs followed my massive dumps (distribution).
***Let's talk about it!...***

Mstercard Inc (MA)Expecting price to lose at least 6% of it's value from current price (270)
Likelihood of success: > 75%
R/R ratio: 1:2

MA - Bull Put Spread - J hook Classic..Not my usual setup but chart showing classic J Hook setup.
PA is hitting S/R at 265.
RSI showing sings of Oversold.
Volume continues to Increase.
Will watch how PA opens today and take a view.
Looking for PA to consolidate before Reversal to Mean Higher.
Looking at 265/260 Put Credit Spread with 270 Call for Higher Bias.
Sept Exp.
Good Luck - Watch your $$$ RISK

$MA Still Bearish! (Nothing has changed!)Make no mistake about it, IT WILL GET UGLY!
***Let's talk about it when it does... ***

Daily MA stock forecast analysis 18-Jul
Price trend forecast timing analysis based on pretiming algorithm of Supply-Demand(S&D) strength.
Investing position: In Rising section of high profit & low risk
S&D strength Trend: About to begin an upward trend as a adjustment trend gradually gives way to increasing limited falls and strong rises.
Today's S&D strength Flow: Supply-Demand(S&D) strength flow appropriate to the current trend.
read more: www.pretiming.com
Forecast D+1 Candlestick Color : GREEN Candlestick
%D+1 Range forecast: 0.9% (HIGH) ~ -0.4% (LOW), 0.3% (CLOSE)
%AVG in case of rising: 1.2% (HIGH) ~ -0.4% (LOW), 0.8% (CLOSE)
%AVG in case of falling: 0.6% (HIGH) ~ -1.1% (LOW), -0.5% (CLOSE)

Daily MA stock price trend forecasts analysis.12-JUL
Investing position: In Rising section of high profit & low risk
S&D strength Trend: In the midst of an upward trend of strong upward momentum price flow marked by the temporary falls and strong rises.
Today's S&D strength Flow: Supply-Demand strength has changed from a weak buying flow to a suddenly strengthening buying flow.
read more: www.pretiming.com
Forecast D+1 Candlestick Color : GREEN Candlestick
%D+1 Range forecast: 1.0% (HIGH) ~ -0.2% (LOW), 0.6% (CLOSE)
%AVG in case of rising: 1.2% (HIGH) ~ -0.4% (LOW), 0.8% (CLOSE)
%AVG in case of falling: 0.5% (HIGH) ~ -1.2% (LOW), -0.5% (CLOSE)


The Banana Shape MA+V+MSFT+CSCO+AXPSometimes a bearish wedge cannot describe how strong a market would be, but a banana shape could.
The Banana Shape of MA+V+MSFT+CSCO+AXP described how strong the market was.

Daily MA forecast analysis report by Supply-demand strength.03-Jul
Price trend forecast timing analysis based on pretiming algorithm of Supply-Demand(S&D) strength.
Investing position: In Falling section of high risk & low profit
S&D strength Trend: In the midst of a rebounding trend of upward direction box pattern price flow marked by limited falls and upward fluctuations.
Today's S&D strength Flow: Supply-Demand(S&D) strength flow appropriate to the current trend.
read more: www.pretiming.com
D+1 Candlestick Color forecast: GREEN Candlestick
%D+1 Range forecast: 0.3% (HIGH) ~ -1.1% (LOW), 0.1% (CLOSE)
%AVG in case of rising: 1.4% (HIGH) ~ -0.2% (LOW), 1.0% (CLOSE)
%AVG in case of falling: 0.6% (HIGH) ~ -1.4% (LOW), -0.9% (CLOSE)

$MA Still a Short! (BEARISH!)*** Don't be fooled by today's pump... They still haven't cured Cancer! ***
They have nothing to justify a +50% in price in just 6 months...
***If you know something... Let's talk about!***

MA setting itself up for another move upIt wouldn't take much for this to breakout of this bull flag pattern tomorrow.

MA - Bull Put Credit SpreadDaily RSI very Oversold. Bounce Off BB% .50 & S/R Level
Aiming for 255/250 Bull Put with 260 Call for Directional Bias
Exp July
Good Luck - Watch YOUR RISK.

$MA Still BearishSo Many short on the market right now after that Friday epic pump. SBUX, V, AXP, VEEV and so many more ... It's open buffet right now, the meltdown will be epic.

MA LONG SWING. Entry on retracement MA has been trending to the upside for quite some time. Although markets are way overbought there is still no sign of considerable weakness. Hence for a bullish setup MA is a good choice since this is a very strong performing stock. Feel free to adjust the stop protection based on your risk tolerance. Since there is no prior resistance area , a trailing stop or other techniques can be used to maximize profits. NOTE: Today's bullish candle needs to close solid bullish or blue on a chart for this setup to work better
app.box.com


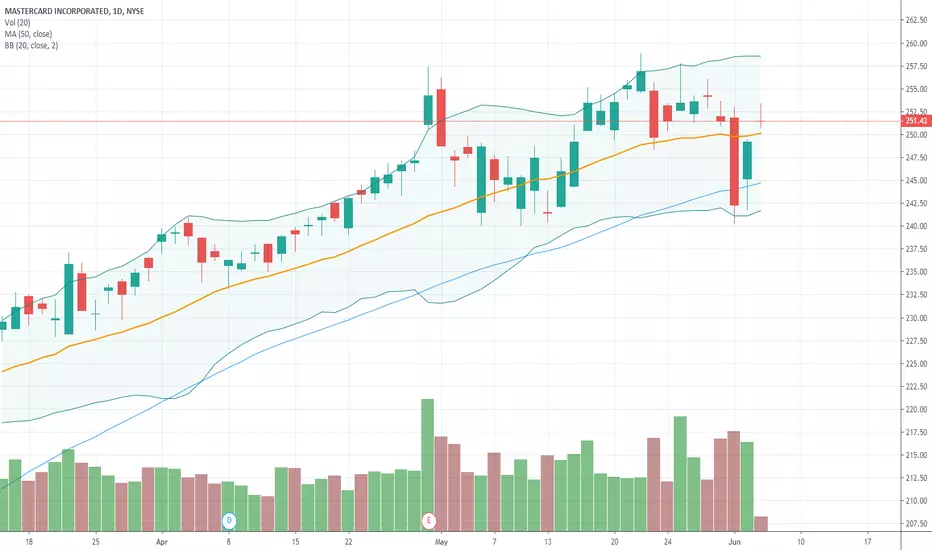
Mastercard Trying To Make A Move UpMastercard crossed both the 50-day and 10-week moving average, and is today testing support of the 20 day moving average (center line of the Bollinger bands) after an overnight gap up. It is also among the top 10 in the buy zone on IBD's Leaderboard.

Mastercard SMA and EMA trend indicatorsThe simple moving average of the last 10 days and the exponential moving average of the last 30 days show an upward trend and two resistance lines with a range that goes from $246.41 to $251.11

MA + V Long Term ShortsMastercard + Visa long term shorts. Mastercard's and Visa's biggest long term competitors are seeing massive growth in a booming crypto market. Will follow up on this later.
