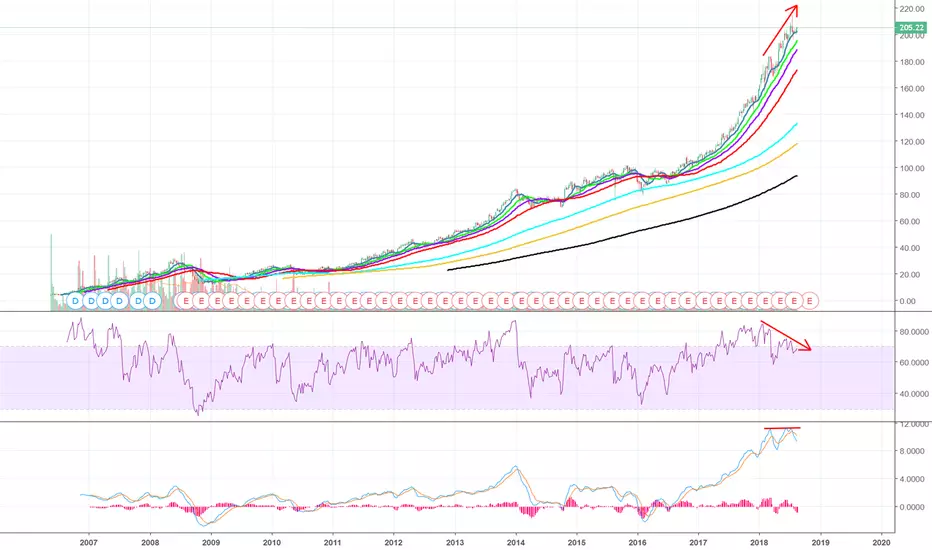
Short term BearishMomentum is slowing down.
Downtrend is healthy
Forming LL, LH, LL, LH
Short term Bearish.
I may open Bull Put Credit Spreads by the end of trading day tomorrow.
DTE = 45 days
Good luck to you.
Mastercard Incorporated Class A
No trades
Trade ideas

WindowThe price is just going to close the window at around 203. If this would fail or when this will be done the trend shall continue.

MA has been oversoldMy quant model predicts
Profitability: it has a high probability(80%) to rebound at this level.
Worst Case: it could drop to $171.49
Money Management: Bet no more than 20% of capital
Suggested Strategy: long stock for 5 Days, wait and exit


Mastercard shares offer a buying opportunityMA shares have been a fabulous growth story for years. The sales, EPS, & div growth have been top notch and this pullback can be a great entry for a long-term outperformer.


MA Long on Short-TermBuy Limit 208.00
Stop Loss 198.00
Doji star with 2 gaps is formed at support line. It just reached 0.618 Fib retracement level.
Many NASDAQ stocks have similar formations, which means that the market is turning uptrend
S&P500, DJI and NASDAQ are at important support level.
RSI went down too quickly. It means an imminent up in price.
I will give a sell indication later.
Stay tuned for update


MA shows bullish trading activityMA shares broke out to new highs on big volumes. This trend should continue.


Short SellFollow the comments on the chart! If the price goes up to the size of the stop loss point, put the stop loss on the entry point, Stop loss means that the closing price must be below the Stop line, the shadows are not acceptable. NYSE:MA SP:SPX

MA - Counterattack candle pattern, RSI positive reversal,...RSI shows positive reversal, stochastic is about to golden cross the signal line from oversold zone. Candles from today and yesterday form a counterattack pattern. July 30th and 31st candles form a tweezers bottom pattern (lower wicks will act as support, and can also be used as stop). All these indicate a bottom reversal.

Buy Alert for "MA"My WT Cross strategy has alerted me to a buy signal for Mastercard(MA) at $207.89, so my idea is to buy the dip.


