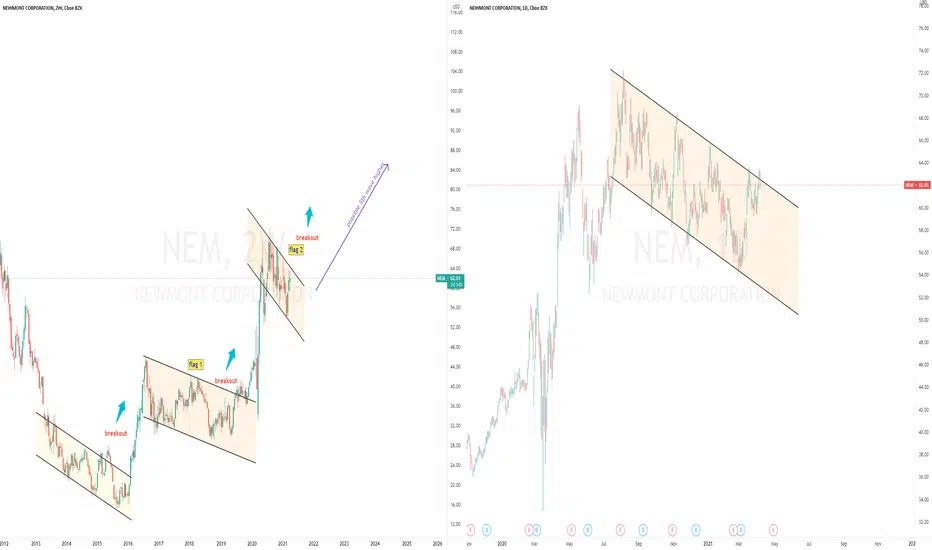
Newmont CorporationChart pattern: Bull flag
Entry: 65.78$ (this would end the downtrend which is active since the beginning of August 2020)
Stop: 54.18$
Target: 93.354
Stopmanagement: ATR Stops weekly chart default settings
Risk:Reward-Ratio: > 2.3:1
Description: Since August 2020 the chart is forming a bull flag with a nice corrective pattern (which retraced under the 38 Fibonacci retracement). Target is the 1:1 Fibonacci extension of the former impusliv move. Additionally, the MACD is also confirming the change in trend.
Ordersize: If you have a 10000K to trade and you only want to risk 1% of your volume, you can enter this trade with 570$.
NMM trade ideas


NEM - Gold and Precious Metals Stocks - Large Cap Leadership...?NEM is close to breaking through a bullish flag. We need a couple more days to confirm. Large caps will lead the smaller caps so all eyes on NEM and ABX. GDXJ is in a bullish flag as well - but has more work to do, hints will come from NEM/ABX.
All adding to the positive technicals for XAU, XAG and the PM stocks. Cautiously bullish at this stage.


Buy $NEM - NRPicks 28 FebNewmont is the world's largest gold producer. In 2020, the company produced 5.9 million attributable ounces of gold and more than 1 million attributable gold equivalent ounces from by-product sales. In the long term, the company expects to produce 6.5 to 7 million ounces of annual gold production while reducing all-in sustaining costs to $800 to $900 per ounce.
Newmont is a company that appears to have been unaffected by the pandemic, as we see no significant damage to sales. The current year's results have been better than last year, likewise, we can see that its debt level is in line with its competitors.
- Value
-2.9% estimated net earnings growth for the next 3 years.
- ROE 11.0% VS 13% industry average
- P/B 2x VS 2.3x industry.
Technicals:
- Price level below SMA 250-200-150-100
- Williams R% at -94% levels
- RSI (32) Oversold
- -8% average downside during the month
A 17% correction was presented from January 8 to February 26, which stopped at $54.30 support. This pullback was mainly due to the fortune that the dollar has been gaining and the increase in 10-year bond yields. Ultimately, the buy decision is driven by the strength of the company and that the technical indicators are favorable.


Newmont's Quarterly Log ChartIn a bullish transition zone, right below 2011 quarterly defined highs.
Convincing quarterly close above 64$ opens the floodgates.
255$ target.


NEWMONT GOLDCORP (NEM) Buy Signals on W1.NEWMONT GOLDCORP (NEM),W1: Support line + Mirror level + Inside Bar + Bollinger bands

# NEM Waite for green area and enter long for 62 target # NEM# NEM
# NEM Waite for green area and enter long for 62 target # NEM
# NEM Waite for green area and enter long for 62 target # NEM
# NEM Waite for green area and enter long for 62 target # NEM
thanks

NEM-BUYGold, Copper, Silver, Royo ...
Located in America
Strong balance sheet
Income report has not been provided yet but the forecasts are very good

NEWMONT CORPORATION (#NEM) - ReversalNYSE:NEM
- Good reversal on important support level
- RSI leaving the low point
- MACD is sloping up
- Upside potential till the downward trendline
Entry @ USD 60.12
PT. @ USD 63.00
SL. @ USD 58.00


NEM has just made a double bottomNEM has just made a double bottom and is heading up. You need to get into this quickly if you want to make some money. NEM will likely go to $65 where there will be some resistance if it goes past that look for the price to go to $68.

Buy $NEM on rare alertNewmont mining may have just published a false breakout (FBO) beneath the recent wedge formed and the 50 Week MA. We received a rare block alert ahead of the final seasonality run into late February.

Newmont CorporationNewmont could provide us with a good opportunity to buy in on a pullback. Just some perspective.
