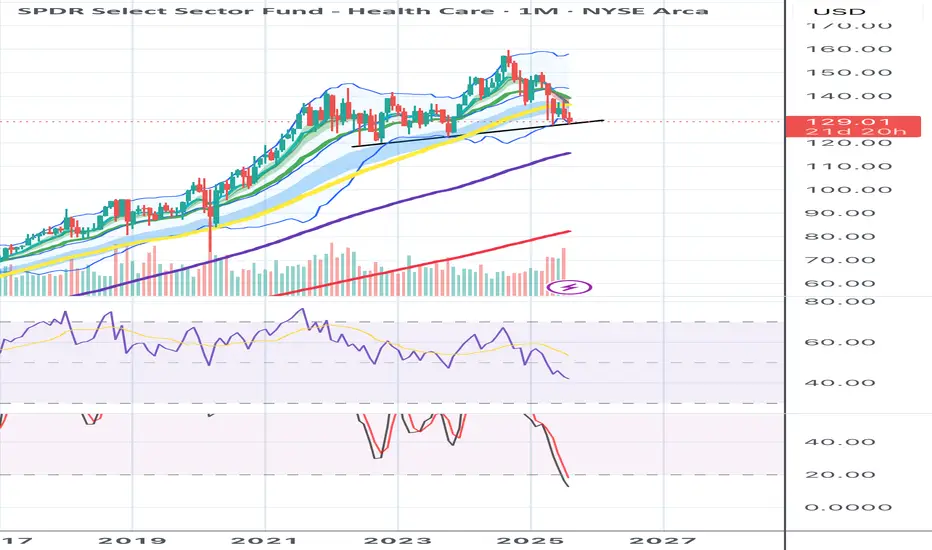
$XLV:Goes for the ATH I believe AMEX:XLV is getting ready to challenge its all-time highs in the upcoming weeks.
The rise from the April low is impulsive
Key stats
About Health Care Select Sector SPDR Fund
Home page
Inception date
Dec 16, 1998
Structure
Open-Ended Fund
Replication method
Physical
Dividend treatment
Distributes
Distribution tax treatment
Qualified dividends
Income tax type
Capital Gains
Max ST capital gains rate
39.60%
Max LT capital gains rate
20.00%
Primary advisor
SSgA Funds Management, Inc.
Distributor
ALPS Distributors, Inc.
ISIN
US81369Y2090
XLV dominates the US health care segment on practically every measure. The fund provides exposure to companies in pharmaceuticals, health care equipment and supplies, health care providers and services, biotechnology, life sciences tools and services, and health care technology industries. XLV is the oldest in the segment, as such it is used widely for strategic or tactical positions. Since XLV is both cap weighted and fishes only from the S&P 500, it tilts heavily toward mega-caps. For focused exposure to leading health care names, XLV is tough to beat.
Related funds
Classification
What's in the fund
Exposure type
Health Technology
Health Services
Stock breakdown by region
Top 10 holdings

$XLV:A BREAK BEFORE RESUMING THE CLIMBThe five-wave impulsive count from the August low may be completed; additionally, the RSI 14 is currently indicating overbought conditions. Wave 5 has nearly reached the 1x1 extension. Additionally, today’s Shooting Star also suggests a pause in the rise. A corrective phase should begin, potentially

$XLV: The expected wave (5) is on standby The MACD sell signal complicates the impulsive count I'm following. Consequently, I'm uncertain whether wave (4) has concluded, suggesting a Flat or triangle pattern may be forming.

XLV - Cheers! - Cup and Handle.=======
Volume
=======
- slight increase
==========
Price Action
==========
- Cup and handle noticed
- Broken and supported above 1 year downtrend line
=================
Technical Indicators
=================
- Ichimoku
>>> price above cloud
>>> Green kumo expanding
>>> Tenken - Above clouds &

Bears Trapped at 30-Year Lows - Spring Loads
The Market Participant Battle:
Bears have systematically beaten bulls into submission at points marked a-b-c on the 4-hour chart, creating increasingly lower lows that pushed XLV from $140+ down to test critical support at $135.72. However, major institutional buyers (point 2) have now stepped in

Bears Trapped at 30-Year Lows - The Healthcare Spring Loads🎯 XLV: The Healthcare Comeback - How Beaten Bulls Are Coiling for a Powerful Reversal
The Market Participant Battle:
Healthcare bulls have been systematically beaten down by institutional sellers over the past several months, with XLV experiencing sustained underperformance versus the broader m

XLV HEALTH CARE SECTORSPDR Health Care Select Sector ETF ( AMEX:XLV ) is consolidating between strong support at 125–130 and resistance near 137.5. Institutional absorption is visible around support, while sellers are defending the 137–138 zone. A gap remains open at 140, which could act as a magnet if price breaks resis

XLV, Healthcare
Swing trading or Buy the dip like installment savings.
But always check the support slope line.

XLV SHORTMonthly chart - Head and shoulders pattern with a break below neckline and 200MA. Target for the pattern is around 118 looking to pick up long term shares there.

Healthcare bottomed (or only 0-3% away). AMEX:XLV has the most oversold readings since 2008.
- Specifically, the 1M slow stochastic is actually MORE oversold now then it was in 2007.
- We are sitting at a major trend line support. There’s plenty of 1-2M hammer candles along this area as well.
- we have pierced the Monthly Bollinger
See all ideas
Summarizing what the indicators are suggesting.
Oscillators
Neutral
SellBuy
Strong sellStrong buy
Strong sellSellNeutralBuyStrong buy
Oscillators
Neutral
SellBuy
Strong sellStrong buy
Strong sellSellNeutralBuyStrong buy
Summary
Neutral
SellBuy
Strong sellStrong buy
Strong sellSellNeutralBuyStrong buy
Summary
Neutral
SellBuy
Strong sellStrong buy
Strong sellSellNeutralBuyStrong buy
Summary
Neutral
SellBuy
Strong sellStrong buy
Strong sellSellNeutralBuyStrong buy
Moving Averages
Neutral
SellBuy
Strong sellStrong buy
Strong sellSellNeutralBuyStrong buy
Moving Averages
Neutral
SellBuy
Strong sellStrong buy
Strong sellSellNeutralBuyStrong buy
Displays a symbol's price movements over previous years to identify recurring trends.
Frequently Asked Questions
An exchange-traded fund (ETF) is a collection of assets (stocks, bonds, commodities, etc.) that track an underlying index and can be bought on an exchange like individual stocks.
XLV trades at 151.69 USD today, its price has fallen −0.09% in the past 24 hours. Track more dynamics on XLV price chart.
XLV net asset value is 151.80 today — it's risen 6.84% over the past month. NAV represents the total value of the fund's assets less liabilities and serves as a gauge of the fund's performance.
XLV assets under management is 39.20 B USD. AUM is an important metric as it reflects the fund's size and can serve as a gauge of how successful the fund is in attracting investors, which, in its turn, can influence decision-making.
XLV price has risen by 7.15% over the last month, and its yearly performance shows a 7.22% increase. See more dynamics on XLV price chart.
NAV returns, another gauge of an ETF dynamics, have risen by 6.84% over the last month, showed a 13.85% increase in three-month performance and has increased by 5.24% in a year.
NAV returns, another gauge of an ETF dynamics, have risen by 6.84% over the last month, showed a 13.85% increase in three-month performance and has increased by 5.24% in a year.
XLV fund flows account for −1.59 B USD (1 year). Many traders use this metric to get insight into investors' sentiment and evaluate whether it's time to buy or sell the fund.
Since ETFs work like an individual stock, they can be bought and sold on exchanges (e.g. NASDAQ, NYSE, EURONEXT). As it happens with stocks, you need to select a brokerage to access trading. Explore our list of available brokers to find the one to help execute your strategies. Don't forget to do your research before getting to trading. Explore ETFs metrics in our ETF screener to find a reliable opportunity.
XLV invests in stocks. See more details in our Analysis section.
XLV expense ratio is 0.08%. It's an important metric for helping traders understand the fund's operating costs relative to assets and how expensive it would be to hold the fund.
No, XLV isn't leveraged, meaning it doesn't use borrowings or financial derivatives to magnify the performance of the underlying assets or index it follows.
In some ways, ETFs are safe investments, but in a broader sense, they're not safer than any other asset, so it's crucial to analyze a fund before investing. But if your research gives a vague answer, you can always refer to technical analysis.
Today, XLV technical analysis shows the buy rating and its 1-week rating is buy. Since market conditions are prone to changes, it's worth looking a bit further into the future — according to the 1-month rating XLV shows the buy signal. See more of XLV technicals for a more comprehensive analysis.
Today, XLV technical analysis shows the buy rating and its 1-week rating is buy. Since market conditions are prone to changes, it's worth looking a bit further into the future — according to the 1-month rating XLV shows the buy signal. See more of XLV technicals for a more comprehensive analysis.
Yes, XLV pays dividends to its holders with the dividend yield of 1.61%.
XLV trades at a premium (0.02%).
Premium/discount to NAV expresses the difference between the ETF’s price and its NAV value. A positive percentage indicates a premium, meaning the ETF trades at a higher price than the calculated NAV. Conversely, a negative percentage indicates a discount, suggesting the ETF trades at a lower price than NAV.
Premium/discount to NAV expresses the difference between the ETF’s price and its NAV value. A positive percentage indicates a premium, meaning the ETF trades at a higher price than the calculated NAV. Conversely, a negative percentage indicates a discount, suggesting the ETF trades at a lower price than NAV.
XLV shares are issued by State Street Corp.
XLV follows the S&P Health Care Select Sector. ETFs usually track some benchmark seeking to replicate its performance and guide asset selection and objectives.
The fund started trading on Dec 16, 1998.
The fund's management style is passive, meaning it's aiming to replicate the performance of the underlying index by holding assets in the same proportions as the index. The goal is to match the index's returns.