Crude Oil Trading Map: Bullish Momentum vs Key Resistance🛢️ WTI Crude Oil (USOIL/XTIUSD) – Energies Market Wealth Strategy Map ⚡
🎯 Trade Plan (Swing/Day Trade Vibe)
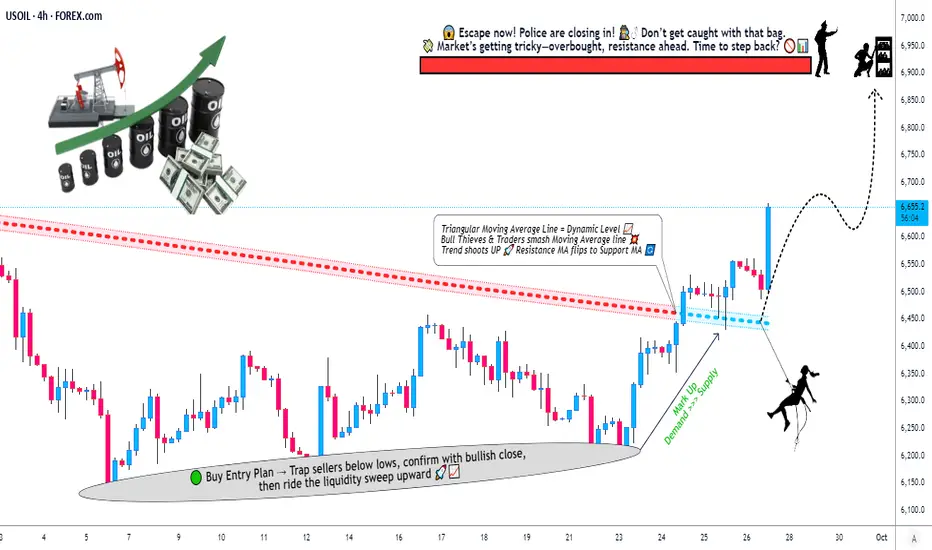
📌 Bias: Bullish setup confirmed by Triangular Moving Average dynamic resistance breakout.
💰 Entry (Thief Layering Strategy):
We don’t just walk in the front door — we layer like true OG’s.
Buy Limit Layers: 6450, 6500, 6550, 6600
You can always add more “layers” depending on your conviction & style.
🛑 Stop Loss (Thief Escape Plan):
Suggested SL: 6350
⚠️ Note: Dear Ladies & Gentlemen (Thief OG’s) — I’m not recommending you use only my SL. Risk is yours, profit is yours. Protect your bag your way.
🎯 Target Zone (Profit Heist Exit):
First escape point: 6900
Above here? Careful. Around 6950 sits a Police Barricade 🚔 (Resistance + Overbought Trap). That’s where the chase gets real — don’t overstay!
🔑 Key Notes for the Thief OG’s:
Layering Strategy: Spreading entries reduces exposure & maximizes flexibility.
Dynamic Resistance Breakout: Momentum shift confirms bulls are sneaking in.
Psychological Trap @6950: Overbought zones = potential reversals.
🔗 Correlation & Related Pairs to Watch:
TVC:USOIL / FXOPEN:XTIUSD (Primary Chart)
BLACKBULL:BRENT / TVC:UKOIL → Closely tracks WTI, sometimes diverges.
FX:USDJPY & TVC:DXY → Oil often inversely correlated with the US Dollar.
OANDA:XAGUSD & OANDA:XAUUSD → Commodity cousins, useful for cross-market sentiment.
FOREXCOM:SPX500 & NASDAQ:NDX → Risk-on sentiment can boost crude oil demand outlook.
✨ “If you find value in my analysis, a 👍 and 🚀 boost is much appreciated — it helps me share more setups with the community!”
⚠️ Disclaimer: This is a Thief Style Trading Strategy — just for fun and market education. Not financial advice. Trade at your own risk.
#USOIL #XTIUSD #CrudeOil #WTI #EnergyMarkets #SwingTrade #DayTrading #TechnicalAnalysis #TradingStrategy #ThiefStrategy
XTIUSD trade ideas
Oil Bulls Beware: 65.5 Could Be the Turning Point📲 NFX Oil Trade Alert – Quick View
GBEBROKERS:USOIL – Resistance Test in Play
📍 Current Level: 65.00
📈 Next Target: 65.45–65.90 (38.2% Fib + Supply-Demand Zone)
⚠️ RSI likely to hit overbought at this zone → potential short setup
📉 Bias: Bearish rejection at 65.5 (preferred scenario) → Target back to 62
🔎 Catalyst: Bullish ECONOMICS:USGPRO EIA report, but effect already priced in from Monday’s rally.
📊 Oil Trade Analysis – Detailed Breakdown
FX:USOIL tested 65.00 after breaking out of the 64.1–64.5 SR zone post–EIA report (23.6% Fib retracement). This marks the second bullish report in a row, but this one was weaker, and the reaction looks mostly priced in after the rally from Monday to today.
Currently, price is hovering around 65.00, which is acting as a minor support. While this level may hold temporarily, it’s unlikely to sustain against broader resistance at 65.5.
I’m expecting price to push further towards the 38.2% Fib retracement (65.45–65.90), which also aligns with a major supply-demand zone. At this level, RSI will likely flash overbought, making it my preferred area to look for shorts.
🔀 Scenarios
Path A – Bearish Rejection (Most Probable)
Resistance holds at 65.5 zone.
Expectation: Sharp rejection → price retraces back to 62 (lower band of range).
Path B – Extended Rally (Less Probable)
Price breaks and sustains above 65.9.
Would invalidate immediate short setup and open path towards higher Fib levels.
⚖️ Fundamentals
While the EIA report acted as a short-term catalyst, supply hike remains a heavy bearish overhang. Nothing has changed on the bigger picture.
💬 Game Plan
Watching closely for clear rejection at 65.5. That’s where I’ll be pulling the trigger for shorts.

Crude OilUS Oil
- Consolidation phase as an corrective pattern in Long Time Frame
- RSI - Divergence
- Bullish Channel in Short Time Frame
- Completed " 1234 " Impulsive Wave
- Break of Structure

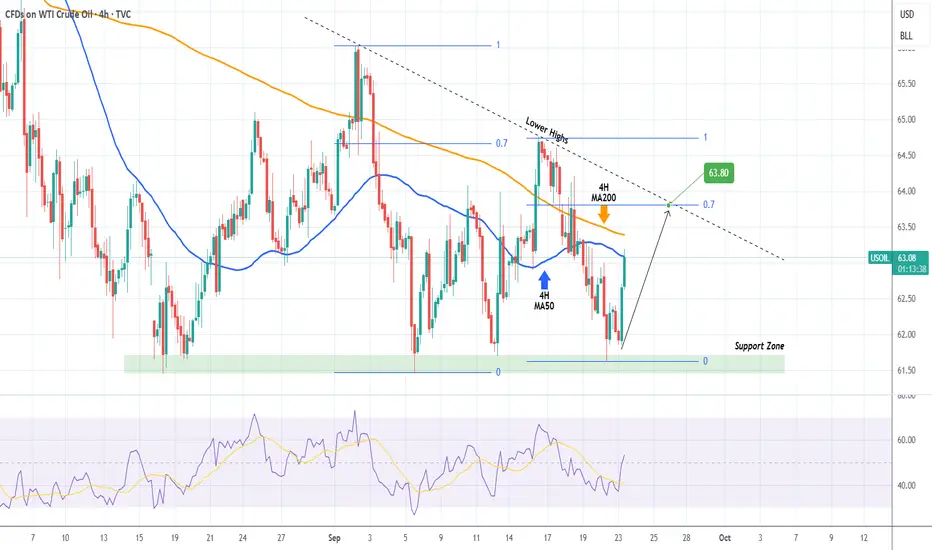
WTI OIL Descending Triangle targeting its top.WTI Oil (USOIL) has been trading within a Descending Triangle and following yesterday's test of its Support Zone, it is rebounding.
This Bullish Leg has already touches the 4H MA50 (blue trend-line) and based on the previous one, it should extend to at least the 0.7 Fibonacci retracement level.
This gives us a 63.80 Target before the pattern's Lower Highs trend-line is tested.
-------------------------------------------------------------------------------
** Please LIKE 👍, FOLLOW ✅, SHARE 🙌 and COMMENT ✍ if you enjoy this idea! Also share your ideas and charts in the comments section below! This is best way to keep it relevant, support us, keep the content here free and allow the idea to reach as many people as possible. **
-------------------------------------------------------------------------------
💸💸💸💸💸💸
👇 👇 👇 👇 👇 👇

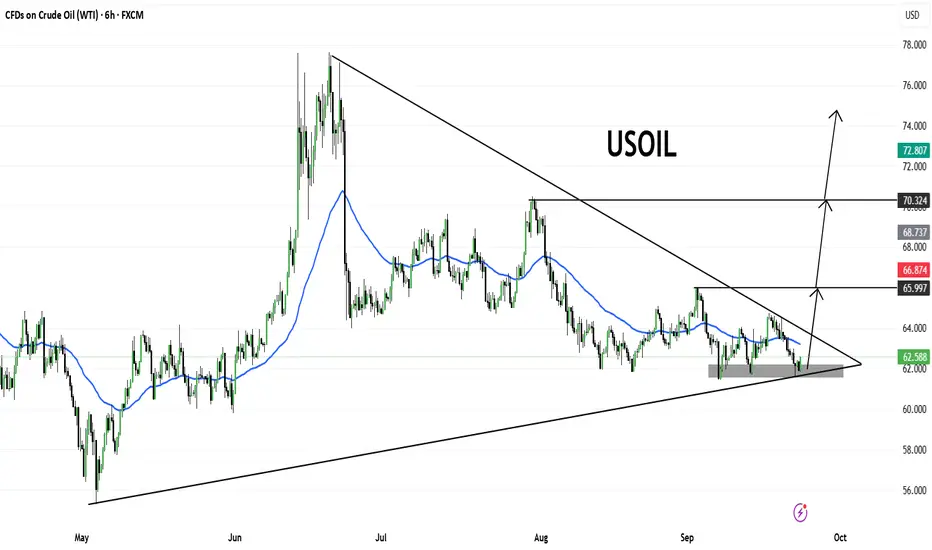
USOILPrice is consolidating inside a large symmetrical triangle pattern, with strong support forming around the $62.00–62.50 zone. A breakout is approaching as price nears the apex.
🔹 Key levels to watch:
Resistance zone: $65.99 – $66.87
Major breakout confirmation: $70.32
Upside target (if breakout sustains): $72.80 – $74.00
🔹 Bias:
As long as $62.00 holds, bulls may attempt a breakout towards the upper resistance trendline. A clean close above $66.87 could trigger momentum toward $70.32 and potentially $72+.
⚠️ However, a failure to hold $62.00 support may invalidate the bullish setup and push price lower.
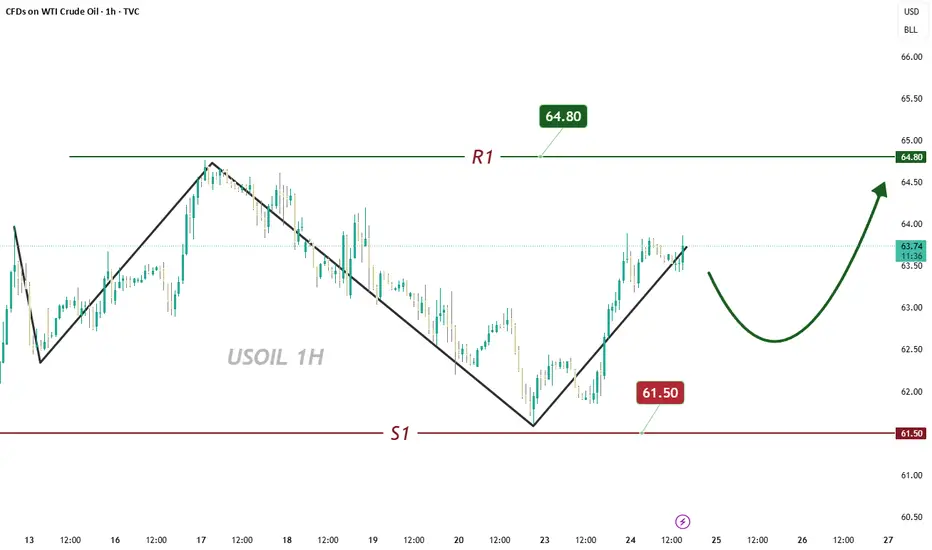
Could we see a bullish reversal?WTI Oil (XTI/USD) is reacting off the pivot which is a pullback support and could rise to the 1st resistance.
Pivot: 62.08
1st Support: 60.99
1st Resistance: 64.18
Disclaimer:
The above opinions given constitute general market commentary, and do not constitute the opinion or advice of IC Markets or any form of personal or investment advice.
Any opinions, news, research, analyses, prices, other information, or links to third-party sites contained on this website are provided on an "as-is" basis, are intended only to be informative, is not an advice nor a recommendation, nor research, or a record of our trading prices, or an offer of, or solicitation for a transaction in any financial instrument and thus should not be treated as such. The information provided does not involve any specific investment objectives, financial situation and needs of any specific person who may receive it. Please be aware, that past performance is not a reliable indicator of future performance and/or results. Past Performance or Forward-looking scenarios based upon the reasonable beliefs of the third-party provider are not a guarantee of future performance. Actual results may differ materially from those anticipated in forward-looking or past performance statements. IC Markets makes no representation or warranty and assumes no liability as to the accuracy or completeness of the information provided, nor any loss arising from any investment based on a recommendation, forecast or any information supplied by any third-party.

Bearish reversal?WTI Oil (XTI/USD) has rejected off the pivot and could drop to the 1st support which acts as a multi swing low support.
Pivot: 63.97
1st Support: 57.80
1st Resistance: 68.85
Disclaimer:
The above opinions given constitute general market commentary, and do not constitute the opinion or advice of IC Markets or any form of personal or investment advice.
Any opinions, news, research, analyses, prices, other information, or links to third-party sites contained on this website are provided on an "as-is" basis, are intended only to be informative, is not an advice nor a recommendation, nor research, or a record of our trading prices, or an offer of, or solicitation for a transaction in any financial instrument and thus should not be treated as such. The information provided does not involve any specific investment objectives, financial situation and needs of any specific person who may receive it. Please be aware, that past performance is not a reliable indicator of future performance and/or results. Past Performance or Forward-looking scenarios based upon the reasonable beliefs of the third-party provider are not a guarantee of future performance. Actual results may differ materially from those anticipated in forward-looking or past performance statements. IC Markets makes no representation or warranty and assumes no liability as to the accuracy or completeness of the information provided, nor any loss arising from any investment based on a recommendation, forecast or any information supplied by any third-party.

Overbought NO where in Sight I keep seeing people stating that Crude is overbought but on the 1day time frame it is just beginning.
If it were me I would be mindful of placing short orders for oil at this time and continue to look for long opportunities during the NY sessions.
Thats just me though 🤷🏽♀️
USOIL: 70$ BREAKOUT ROCKET FUELED! Black Gold Rally 🛢️ USOIL: 70$ BREAKOUT ROCKET FUELED! Black Gold Rally 📊
Current Price: $65.465 | Date: Sept 27, 2025 ⏰
📈 INTRADAY TRADING SETUPS (Next 5 Days)
🎯 BULLISH SCENARIO
Entry Zone: $65.20 - $65.60 📍
Stop Loss: $64.80 🛑
Target 1: $66.50 🎯
Target 2: $67.30 🚀
🎯 BEARISH SCENARIO
Entry Zone: $65.80 - $66.20 📍
Stop Loss: $66.60 🛑
Target 1: $64.70 🎯
Target 2: $64.00 📉
🔍 TECHNICAL ANALYSIS BREAKDOWN
📊 KEY INDICATORS STATUS:
RSI (14): 59.4 ⚡ Bullish Momentum Zone
Bollinger Bands: Mid-Band Breakout 🔥
VWAP: $65.35 - Acting as Springboard 💪
EMA 50: $64.80 ✅ Golden Cross Setup
Volume: Institutional Interest Rising 📊
🌊 WAVE ANALYSIS:
Elliott Wave: Wave 3 Impulse Loading 🌊
Fibonacci Target: $68.50 (161.8%) 🎯
🔄 HARMONIC PATTERNS:
Bullish Bat Completion at $64.90 ✨
ABCD Pattern targeting $67.20 🔄
⚖️ SWING TRADING OUTLOOK (1-4 Weeks)
🚀 BULLISH TARGETS:
Psychological: $70.00 🏆
Weekly Resistance: $68.80 🌙
Gann Level: $69.25 ⭐
📉 BEARISH INVALIDATION:
Weekly Support: $63.50 ⚠️
Critical Break: $62.00 🚨
🎭 MARKET STRUCTURE:
Trend: Ascending Triangle 💪
Momentum: Energy Building 🔥
Wyckoff Phase: Accumulation End 📈
Ichimoku: Bullish Cloud Entry 🟢
⛽ OIL MARKET DYNAMICS:
Supply Cuts: OPEC+ Extensions 🛢️
Demand Growth: Winter Season 🌨️
Inventory Draws: Bullish Data 📉
Geopolitical Premium: Risk-On ⚔️
⚡ RISK MANAGEMENT:
Max Risk per Trade: 2% 🛡️
R:R Ratio: Minimum 1:2 ⚖️
Breakout Confirmation: $66.00 hold 📏
🌍 FUNDAMENTAL CATALYSTS:
EIA Reports Supporting Bulls 📈
Middle East Tensions Premium 🌍
China Demand Recovery Signs 🏭
US Dollar Weakness Helping 💵
🔥 CRITICAL LEVELS TO WATCH:
Breakout Zone: $66.00-$66.30 💥
Support Cluster: $65.00 | $64.50 | $64.00 🛡️
Resistance: $66.50 | $67.50 | $68.00 🚧
🎯 FINAL VERDICT:
WTI primed for $70 EXPLOSIVE RALLY! 🚀
Black Gold showing institutional love! 💎
Supply-demand imbalance = bullish fuel! ⛽
Trade Management: Buy dips above $65.00 💰
Breakout Watch: $66.30 decisive level! 🔔
---
⚠️ Disclaimer: Commodity trading carries high risk. Use appropriate position sizing. Educational analysis only.
For individuals seeking to enhance their trading abilities based on the analyses provided, I recommend exploring the mentoring program offered by Shunya Trade. (Website: shunya dot trade)
I would appreciate your feedback on this analysis, as it will serve as a valuable resource for future endeavors.
Sincerely,
Shunya.Trade
Website: shunya dot trade
🔔 Follow Oil Market Updates | 💬 Drop Your $70 Oil Timeline

CRUDE OIL (WTI): Strong Intraday Confirmation
A quick follow-up for the yesterday's analysis on WTI Crude Oil.
The price went up as I predicted.
The market managed to violate a resistance line of a bullish flag pattern
on an hourly time frame, providing a strong intraday confirmation.
The price will likely grow more and reach 65.58 level after a completion of a retracement.
❤️Please, support my work with like, thank you!❤️
I am part of Trade Nation's Influencer program and receive a monthly fee for using their TradingView charts in my analysis.

WTI Crude Oil🔹 I’ve marked the key resistance zones.
🔹 If I see a reversal signal at any of these levels, I’ll go short.
🔹 The breakout scenario is always valid too—if a level breaks, I’ll take the trade in the direction of the market.
🚫 No bias towards numbers, levels, or analysis.
✨ The key is to flow with the market, not fight it. If you try to stand against it, the market won’t just take your money—it will crush your confidence too.
🎯 We’re only a small part of a bigger picture. Stay flexible, stay unbiased.

Crude Oil (WTI) Technical OutlookCrude Oil (WTI) has recently tested a critical resistance zone around $65, showing strong upside momentum after weeks of consolidation. The chart structure suggests a potential bullish breakout, with price action forming higher lows and pressing against a key supply level.
If WTI holds above $65, the next upside targets lie at:
$67.80 – intermediate resistance
$68.98 – major technical level aligned with previous supply
$70.50 – $71.00 – key psychological resistance and prior swing high
A short-term retest of $65 may act as confirmation before continuation toward the $70+ region. Failure to hold above $64.50 could invalidate the bullish scenario and open a move back toward $62.
This analysis highlights institutional order flow dynamics and key liquidity levels, indicating that crude oil may be setting up for a significant directional move. Traders should watch for clean breaks and retests at major support/resistance zones before positioning.
📌 Summary:
Bias: Bullish above $65
Targets: $67.80 → $68.98 → $70.50+
Risk: Breakdown below $64.50

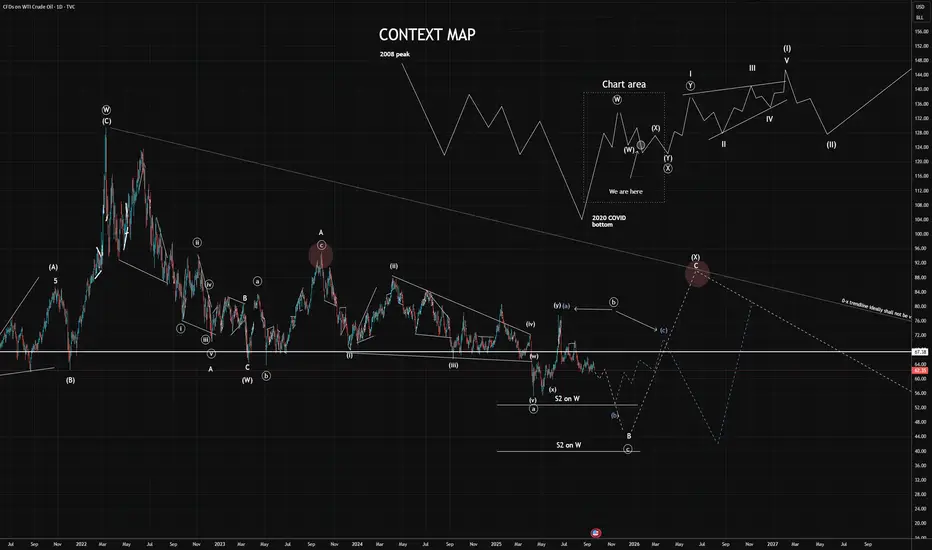
ROADMAP FOR OIL: Volatility Now, a Geopolitical Spark LaterThis isn't an update because the outlook has changed—it's been remarkably stable for months and even couple of years. Instead, this is about connecting the dots as we potentially approach a major inflection point.
Here’s the core idea: major geopolitical events aren't the drivers of crowd sentiment and price action. It's the other way around. Events like OPEC decisions or strikes on Iran happen when social mood has reached a tipping point, pushing politicians to act. These events cause volatility spikes on the chart but don't change the underlying trend; they simply create the corrective waves within it.
The chart is telling us that after the upcoming decline we're anticipating (based on wave count and indicators), a very powerful rally is due. This implies a major geopolitical catalyst, likely in late 2025 or 2026. Crucially, this spike will itself be just a large corrective wave up, setting the stage for the next major leg down in price.
The Technical Setup:
We're inside a complex double zigzag - - correction. The current (X) wave should unfold as either a combination (W)-(X)-(Y) or a flat pattern (A)-(B)-(C). A key tenet is that the trendline connecting the tops of and shouldn't be broken. That line is hard to define right now, which tells me the high for wave isn't in yet. This points to sustained and elevated volatility in the coming months.
The Big Picture (The Supercycle):
COVID likely marked the absolute bottom for energy prices. We are now in a major multi-decade upward supercycle. However, this cycle is so vast that we are still in its very first large wave. The entire corrective phase we're in now began in 2022 and could last until the late 2020s, potentially culminating in a global crisis sparked by conflict, escalating into trade wars, and exacerbated by the financial system vulnerabilities everyone is now preparing for.
Layer on top of that potential US production exhaustion and a post-2030 output decline across India and Asia, and you have a perfect recipe for a powerful oil rally in the future. But that story is for the next decade. For now, fasten your seatbelts for some turbulence.
#Oiltrading #ElliottWave #Socionomics #Macro #Trading #Geopolitics #Energy #Supercycle #Commodities
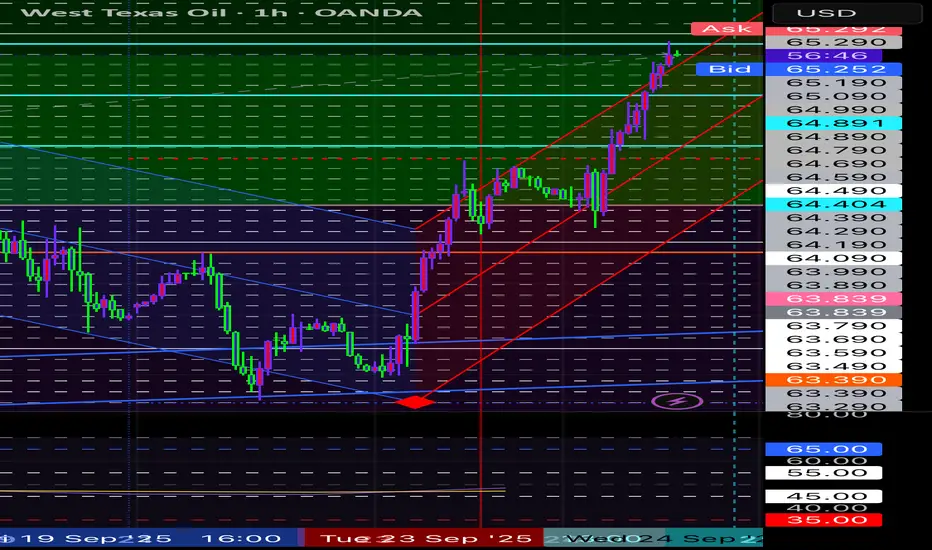
OIL (WTI) – Trading Plan | Sep 26, 2025🔎 Technical Analysis of OIL (WTI) – Sep 26, 2025
1. Main Trend
- On the H1 timeframe, oil is in a medium-term uptrend, reflected by the ascending trendline extending from Sept 24 until now.
- Price has just had a strong breakout above the weekly VAH (65.45), confirming buying pressure dominance.
2. Key Zones
Resistance:
- 65.80 – 66.00: short-term resistance recently rejected.
- 66.50 – 67.00: stronger resistance zone, overlapping the previous swing high.
Support:
- 65.45 (VAH): nearest support; as long as price stays above this, the uptrend is reinforced.
- 65.10 – 64.60 (POC): central support, balance area.
- 63.00 – 62.90 (VAL): deeper support, previous volume low.
3. Price Action
-- Price had a strong breakout candle up to 66.00 but was rejected, now pulling back slightly toward VAH 65.45.
- The breakout was accompanied by large volume → buyers are in control, but short-term profit-taking pressure is appearing.
- If price holds above VAH, the uptrend will likely continue. If it falls back below POC 64.60, selling pressure may return.
4. Candlestick Pattern
- A rejection candle appeared at 66.00 with a long upper wick → short-term bearish signal.
- However, candles around VAH show small bodies → market is waiting for pullback confirmation.
5. Trading Plan (in order of priority)
📌 Scenario 1 – Buy with the trend (priority):
- Buy if price retests VAH 65.45 successfully or around POC 65.10 – 64.60.
- TP: 66.00 → 66.50 → extended to 67.00.
- SL: below 64.40.
📌 Scenario 2 – Buy breakout continuation:
- If price breaks above 66.00 with a strong H1 candle.
- Enter Buy on breakout.
- TP: 66.50 – 67.00.
- SL: below 65.45.
📌 Scenario 3 – Short-term Sell (only if clear signals appear):
- If price fails to hold VAH 65.45 and breaks POC 64.60.
- Enter Sell with momentum.
- TP: 63.00 – 62.90 (VAL).
- SL: above 65.80.
👉 Summary:
- Priority remains on Buy as long as price holds above VAH 65.45.
- If breakout above 66.00 succeeds → continue Buying with the trend.
- Only consider Selling if price drops below POC 64.60.
👉 If you find this analysis useful, don’t forget to hit like 👍 and drop a comment 💬 to support us in delivering even better insights! Or join my channel to get free signal.

WTI 4H🔹 Overall Outlook and Potential Price Movements
In the charts above, we have outlined the overall outlook and possible price movement paths.
As shown, each analysis highlights a key support or resistance zone near the current market price. The market’s reaction to these zones — whether a breakout or rejection — will likely determine the next direction of the price toward the specified levels.
⚠️ Important Note:
The purpose of these trading perspectives is to identify key upcoming price levels and assess potential market reactions. The provided analyses are not trading signals in any way.
✅ Recommendation for Use:
To make effective use of these analyses, it is advised to manually draw the marked zones on your chart. Then, on the 15-minute time frame, monitor the candlestick behavior and look for valid entry triggers before making any trading decisions.

CRUDE OIL FREE SIGNAL|SHORT|
✅CRUDE OIL is going up now
But a strong resistance level is ahead at
Thus I am expecting a pullback and we
Will be able to enter a the following short trade:
------------------------
Entry: 86.500
Stop Loss: 86.700
Take Profit: 86.100
------------------------
SHORT🔥
✅Like and subscribe to never miss a new idea!✅

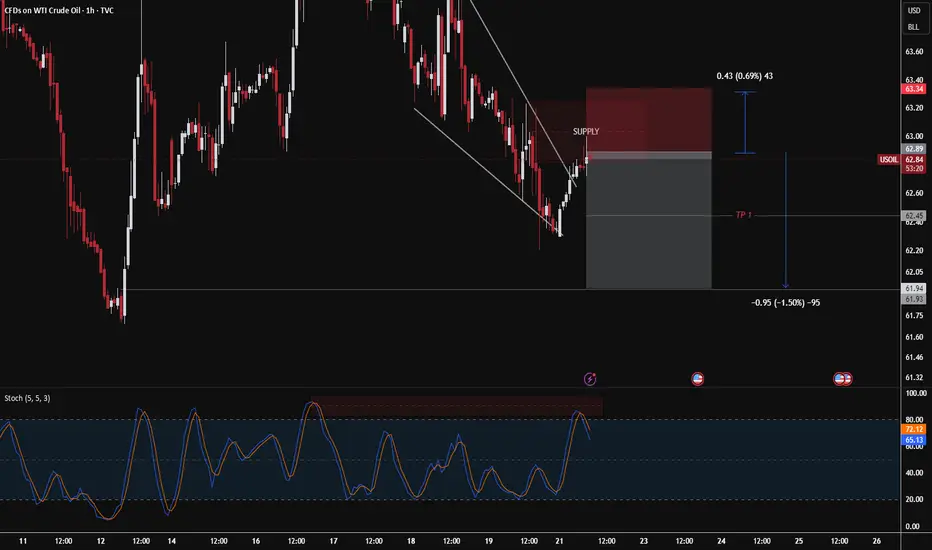
US OIL 🔴 **Entry Zone (Supply):**
≈ 62.89 – 63.34
🔻 **Stop Loss (SL):**
63.34
🎯 **Take Profit (TP):**
* TP1 👉 62.45
* TP2 👉 61.93
📌 Catatan: Harga masuk area supply, potensi rejection turun. Risk kecil – reward lumayan lebar 👌

Crude Oil - Down Fall In 1 Hour Time Frame we can see a Good down Trend formed"
Use the Opportunity and Trade
Use Proper Risk Management" 🔥🔥🔥

70 and 74 incoming Short closed 62..Long from 62 tp 1st Tp 70 and 2nd Tp 74..Good luck and safe trade
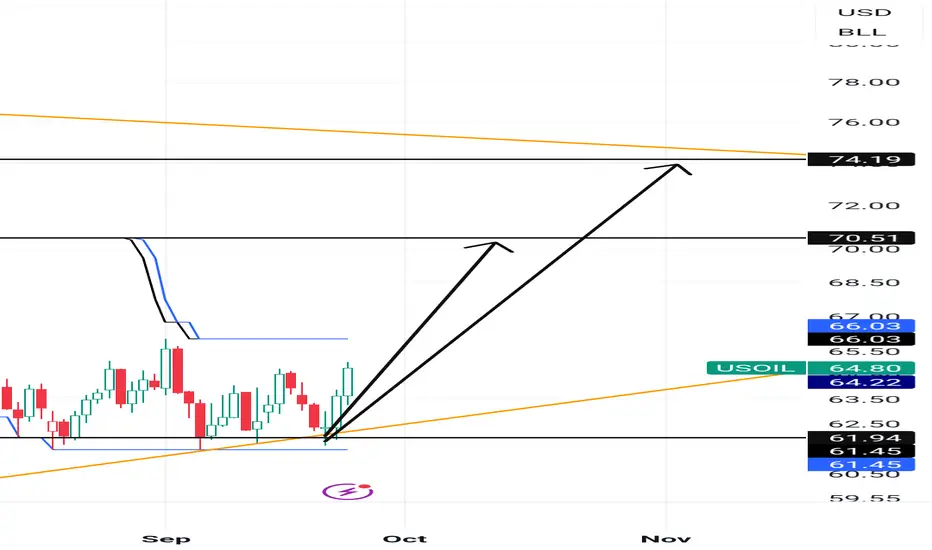
Clear Rebound Post-Pullback, Watch for 2nd Drop After a significant pullback, oil has now seen a clear rebound 📈
However, we need to watch out for a potential second pullback ⚠️ and can opt to go long at lower levels 🐂
Buy 62.2 - 62.6
TP 63.2 - 63.6 - 64.6
Accurate signals are updated daily 📈! If you encounter any issues during trading, these signals can serve as your reliable guide 🧭—feel free to refer to them anytime! I sincerely hope they’ll be of great help to you 🌟
WTI Crude Oil ReboundsWTI Crude Oil Rebounds
Crude oil is recovering and might rise toward the $64.30 resistance zone.
Important Takeaways for WTI Crude Oil Prices Analysis Today
- WTI Crude oil is recovering losses and trading above $62.60.
- There is a major bearish trend line in place with resistance near $63.65 on the hourly chart of XTI/USD.
WTI Crude Oil Price Technical Analysis
On the hourly chart of WTI Crude Oil, the price found support near $61.60 against the US Dollar. The price formed a base and started a recovery wave above $62.60 and the 50-hour simple moving average.
The bulls were able to push the price above the 50% Fib retracement level of the downward move from the $64.32 swing high to the $61.58 swing low. The hourly RSI is above the 60 level, but the price is struggling near $63.65.
Besides, there is a major bearish trend line in place with resistance near $63.65. It coincides with the 76.4% Fib retracement. A close above the trend line resistance might send the price toward the $64.32 high.
The next hurdle could be $65.00. A clear move above $65.00 could send the price toward $66.25. Any more gains might open the doors for a test of $68.00.
Conversely, the price might start a fresh decline from $63.65. Immediate support sits near $62.95. The key breakdown zone on the WTI crude oil chartmight be $62.60 and the 50-hour simple moving average.
If there is a downside break, the price might decline toward $62.60. Any more losses might encourage the bears for a push toward the $61.58 low.
This article represents the opinion of the Companies operating under the FXOpen brand only. It is not to be construed as an offer, solicitation, or recommendation with respect to products and services provided by the Companies operating under the FXOpen brand, nor is it to be considered financial advice.
