Market analysis from Errante
Technical analysis Current technical conditions and main scenario ERRANTE:AUDNZD On the 1-hour chart, price has broken the rising trend line and is riding the lower half of the Bollinger envelope. Candles are clustering beneath the mid Bollinger band (the 20-period SMA, blue) and below the prior 61.8% retracement at 1.1120, while the bands are beginning to...
Market overview USD/CAD is holding around 1.3810 on Thursday after a choppy week of data-driven swings. The dollar is consolidating following softer ISM manufacturing readings that highlighted weakness in US factory activity, while the services sector and labor market will take center stage heading into Friday’s nonfarm payrolls. Traders remain cautious ahead of...
Technical Analysis If buyers overcome the resistance at 147.52, the path to further gains opens, with Fibonacci extensions at 147.64 (127.2%), 147.79 (161.8%), and 147.95 (200%) marking likely targets. Oscillator signals are constructive: the stochastic remains in overbought territory, yet not exhausted, signaling potential for further follow-through. MACD...
AUD/NZD continues its climb within a defined rising channel, backed by underlying bullish momentum. Breakout above ~1.0970 would likely open a run toward 1.099–1.100, contingent on supportive risk tone and central bank cues. Failing that, watch for a pullback toward 1.0954 or lower. Keep an eye on this week’s central bank updates for the next catalysts. You can...
Technical Analysis: CHF/JPY hits a one-month low at 182.65, following a steep correction from recent highs. Price trades below both WMA and lower Bollinger band. • Indicators: RSI deeply oversold (29), Stochastics still negative. • Scenario: Swiss franc remains under pressure after recent SNB dovishness, while the yen recovers on global rate cut bets and a softer...
Technical Analysis On the 4-hour chart, USD/CHF is building a recovery from the 0.79441 low. Notably, the pair is not retesting the previous falling trendline but is approaching a critical resistance at the last swing high of 0.79793. If bullish momentum persists, a break above 0.79793 (last swing top and 100% Fibonacci retracement) will open the way to 0.79889...
Market Overview: GBP/AUD has shown signs of recovery this Monday, bolstered by a modest improvement in risk appetite globally. The Australian dollar faces some pressure due to mixed domestic economic signals and external factors such as cautious investor sentiment on China’s growth prospects. Meanwhile, the British pound is supported by steady housing data,...
Technical Analysis The EUR/USD 4-hour chart reflects ongoing bearish pressure after failing to sustain above the 1.17647 resistance zone, indicating sellers are currently dominating the market. The pair trades below the 20-period EMA (blue line), which is beginning to slope downwards, confirming short-term bearish momentum. Price action remains beneath the...
Technical Analysis The CAD/CHF pair remains firmly in a downtrend on the 1-hour chart, with price consistently making lower highs and lower lows, underscoring sustained selling pressure. The price is trading below both the 20-period and 50-period weighted moving averages, which have turned downward, signaling bearish momentum. Price action recently tested the...
Technical Analysis The EUR/CHF 1-hour chart highlights a clear breakout from a symmetrical triangle consolidation pattern, indicating bullish momentum. The price has decisively breached the upper trendline resistance near 0.9335 and surged above the last top resistance at approximately 0.9343, signaling a strong upward impulse. Key levels and technical...
Technical Analysis The gold spot price recently tested resistance near $3,451, marking a significant swing high. Following this, the price has pulled back to the 61.8% Fibonacci retracement level at approximately $3,353, which currently acts as critical support. The daily chart shows gold holding above its 50-day weighted moving average (WMA) around $3,250, with...
Technical Analysis On the 4-hour chart, USD/CAD has broken above the 1.3746 resistance level, which corresponds to the top swing of the recent rally from 1.3687. The breakout above this level is a bullish signal, reinforced by a positive RSI reading above 70, indicating strong buying momentum. The MACD histogram is in positive territory, and the stochastic...
Technical Analysis On the 1-hour chart, EUR/USD is trading near 1.1408, showing a corrective pullback after recent gains. The pair breached a rising trendline support around 1.1411 and is approaching key Fibonacci retracement levels derived from the recent swing low to high. Immediate support lies at the 100% Fibonacci level near 1.1368, with further downside...
Technical Analysis – EUR/USD (1H Chart) EUR/USD is currently trading around 1.1367, slipping after a failed attempt to break above the recent swing high of 1.1406. The pair has now broken below a short-term ascending trendline and is testing the key support drawn from the last bullish leg at 1.1368. Breaking of this level can push the pair lower. The break of...
CAD/CHF Market Outlook – May 14, 2025 CAD/CHF remains in a bullish structure on the 4H chart, with price currently hovering near 0.6010 after rejecting resistance at 0.6032. The pair is testing the 61.8% Fibonacci retracement and holding just above a rising trendline and the WMA, which converge around the 0.5980–0.5994 zone. Momentum has flattened, with RSI at 52...
Technical Analysis On the hourly chart, AUD/CAD is attempting to complete a short-term bullish reversal pattern that began forming after the pair established a base at the psychological level of 0.90000. Buyers have successfully pushed the price above the resistance at 0.90189, gaining proximity to the 100-period moving average—a key area of interest. A sustained...
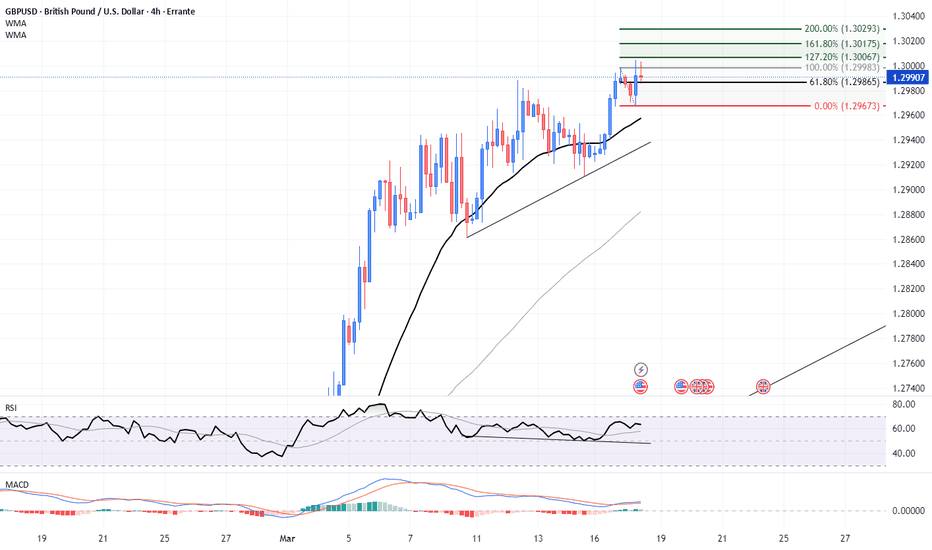
Market Overview The British Pound surged to a four-and-a-half-month high against the US Dollar on Tuesday as expectations grew that the Bank of England (BoE) would refrain from cutting interest rates later this week. Meanwhile, Sterling weakened against the Euro, driven by optimism surrounding Germany’s stimulus plans. The Euro’s strength has contributed to a...
On the four-hour chart, EUR/AUD has successfully broken above its previous downtrend and now trades above the 100-period moving average, reinforcing a short-term bullish outlook. Buyers have managed to clear the 1.65192 resistance level, extending the rally toward the 127.2% Fibonacci extension of the latest bearish swing at 1.65433. A sustained break above this...


