Over the last few sessions, AAPL has been stuck inside a tight range, but the way the price is reacting around 272–275 is starting to get interesting. When I line up the 1-hour, the 15-minute, and the options/GEX map together, the picture becomes clearer: AAPL is closer to a move than most traders realize.
I’ll walk through the logic the same way I analyze it for myself.
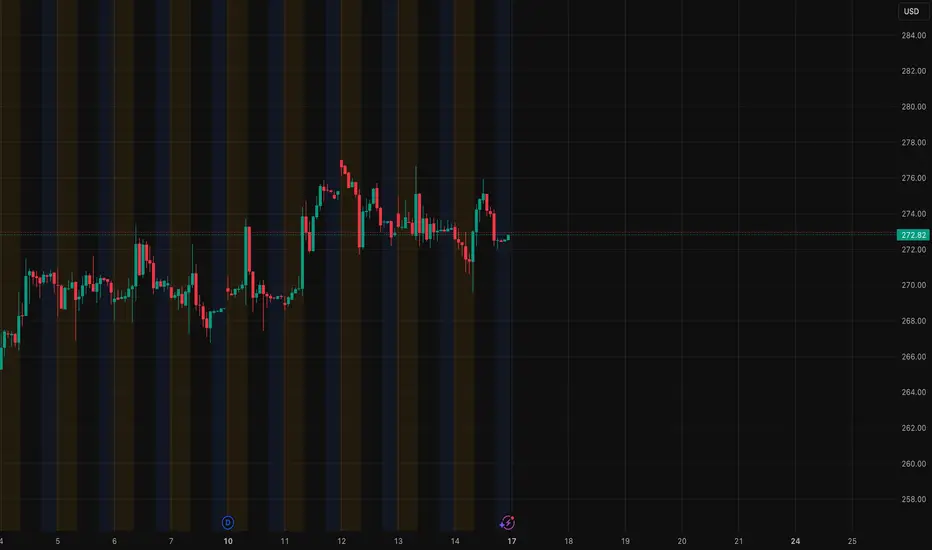
1️⃣ 1-Hour Chart — Market is Coiling
On the 1H chart, AAPL is still respecting the descending channel that has been developing for several days. Lower highs at 277.5 → 275 → 273.8 show sellers leaning on this structure, but the important part is the repeated defense at 272.
Every push into that area gets bought.
The trendline from Friday’s low also hasn’t broken, so instead of a clean downtrend, what we’re seeing is compression. That usually leads to a breakout once one side finally gives up.
So on 1H:
* 273.8 = the line buyers need
* 272 = the line sellers want Whoever breaks first decides the direction.
2️⃣ 15-Minute Chart — Intraday Map Gets Clearer

The 15M chart fills in the short-term structure that isn’t obvious on 1H.
There’s a nice cluster of demand around 272.20–272.60, where an FVG is still open. That’s exactly where AAPL bounced the last time. On the opposite side, supply sits around 273.30–274, and price gets rejected as soon as it touches it.
The EMAs are still flat, showing indecision, so the 15M reinforces the idea that the real move only starts when one side conquers their zone.
To me, the 15M basically says:
* Don’t get chopped in the middle
* Wait for 274 reclaim or 272 flush
* These two zones are clean and respected
3️⃣ Options/GEX Map — The Part Most Traders Miss

This is where the story gets more interesting.
The GEX map shows very clear magnets and barriers:
Upside:
* 276.70–277.00: First major call wall
* 277.50–278.00: Strongest positive GEX zone
If AAPL can clear 273.8, this is the type of structure that often drags price higher even when the chart looks messy. Market makers hedge into strength, and price tends to gravitate toward these zones.
Downside:
* 270.50–271.00: First real put shelf
* 268.60: Strong put wall
* 266.77: Deep hedge zone (fast moves happen here)
What I like about this GEX setup is how well it explains the hesitation in price. AAPL is literally sitting right in the middle of a balanced hedging zone. Once it breaks out of it, the path becomes clean in one direction.
This is why I always use GEX next to price action—it’s the part of the market structure you can’t see on the chart alone.
(And yes, if you’re new to GEX, this is the kind of situation where it becomes extremely useful.)
🎯 How I’m Planning the 11/17 Session
🔼 Bullish Plan (Only if 273.80 breaks)
If AAPL finally gets above 273.8 and holds it, the upside levels are clear.
Stock Trade Idea:
* Entry: 274–274.20
* Targets:
* 275
* 276
* 276.7 → first GEX magnet
* 278 → main GEX magnet
Options Idea:
* 275C or 277.5C
* Get in after 273.8 holds, not before
* Trim at GEX magnets
🔽 Bearish Plan (If 272 fails)
If sellers break 272, the move down can be quick.
Stock Trade Idea:
* Entry: 271.80
* Targets:
* 270.8
* 268.6
* 266.7
Options Idea:
* 270P or 267.5P
* Expect acceleration once 272 cracks, because that level lines up with options hedging pressure
⚠️ Chop Zone: 272.20–273.50
This is the area I won’t trade. Price has no momentum here and both sides get trapped.
Final Thoughts
AAPL doesn’t look explosive at first glance, but the multi-timeframe behavior and the way GEX levels line up tell a different story. This is the type of setup where the breakout tends to be clean once it finally happens.
When price, structure, and dealer positioning all point to the same key levels, it usually pays to wait for the break and then follow the confirmation.
Disclaimer
This analysis is for educational purposes only and is not financial advice. Always manage risk and do your own research before trading.
I’ll walk through the logic the same way I analyze it for myself.
1️⃣ 1-Hour Chart — Market is Coiling
On the 1H chart, AAPL is still respecting the descending channel that has been developing for several days. Lower highs at 277.5 → 275 → 273.8 show sellers leaning on this structure, but the important part is the repeated defense at 272.
Every push into that area gets bought.
The trendline from Friday’s low also hasn’t broken, so instead of a clean downtrend, what we’re seeing is compression. That usually leads to a breakout once one side finally gives up.
So on 1H:
* 273.8 = the line buyers need
* 272 = the line sellers want Whoever breaks first decides the direction.
2️⃣ 15-Minute Chart — Intraday Map Gets Clearer
The 15M chart fills in the short-term structure that isn’t obvious on 1H.
There’s a nice cluster of demand around 272.20–272.60, where an FVG is still open. That’s exactly where AAPL bounced the last time. On the opposite side, supply sits around 273.30–274, and price gets rejected as soon as it touches it.
The EMAs are still flat, showing indecision, so the 15M reinforces the idea that the real move only starts when one side conquers their zone.
To me, the 15M basically says:
* Don’t get chopped in the middle
* Wait for 274 reclaim or 272 flush
* These two zones are clean and respected
3️⃣ Options/GEX Map — The Part Most Traders Miss
This is where the story gets more interesting.
The GEX map shows very clear magnets and barriers:
Upside:
* 276.70–277.00: First major call wall
* 277.50–278.00: Strongest positive GEX zone
If AAPL can clear 273.8, this is the type of structure that often drags price higher even when the chart looks messy. Market makers hedge into strength, and price tends to gravitate toward these zones.
Downside:
* 270.50–271.00: First real put shelf
* 268.60: Strong put wall
* 266.77: Deep hedge zone (fast moves happen here)
What I like about this GEX setup is how well it explains the hesitation in price. AAPL is literally sitting right in the middle of a balanced hedging zone. Once it breaks out of it, the path becomes clean in one direction.
This is why I always use GEX next to price action—it’s the part of the market structure you can’t see on the chart alone.
(And yes, if you’re new to GEX, this is the kind of situation where it becomes extremely useful.)
🎯 How I’m Planning the 11/17 Session
🔼 Bullish Plan (Only if 273.80 breaks)
If AAPL finally gets above 273.8 and holds it, the upside levels are clear.
Stock Trade Idea:
* Entry: 274–274.20
* Targets:
* 275
* 276
* 276.7 → first GEX magnet
* 278 → main GEX magnet
Options Idea:
* 275C or 277.5C
* Get in after 273.8 holds, not before
* Trim at GEX magnets
🔽 Bearish Plan (If 272 fails)
If sellers break 272, the move down can be quick.
Stock Trade Idea:
* Entry: 271.80
* Targets:
* 270.8
* 268.6
* 266.7
Options Idea:
* 270P or 267.5P
* Expect acceleration once 272 cracks, because that level lines up with options hedging pressure
⚠️ Chop Zone: 272.20–273.50
This is the area I won’t trade. Price has no momentum here and both sides get trapped.
Final Thoughts
AAPL doesn’t look explosive at first glance, but the multi-timeframe behavior and the way GEX levels line up tell a different story. This is the type of setup where the breakout tends to be clean once it finally happens.
When price, structure, and dealer positioning all point to the same key levels, it usually pays to wait for the break and then follow the confirmation.
Disclaimer
This analysis is for educational purposes only and is not financial advice. Always manage risk and do your own research before trading.
Disclaimer
The information and publications are not meant to be, and do not constitute, financial, investment, trading, or other types of advice or recommendations supplied or endorsed by TradingView. Read more in the Terms of Use.
Disclaimer
The information and publications are not meant to be, and do not constitute, financial, investment, trading, or other types of advice or recommendations supplied or endorsed by TradingView. Read more in the Terms of Use.