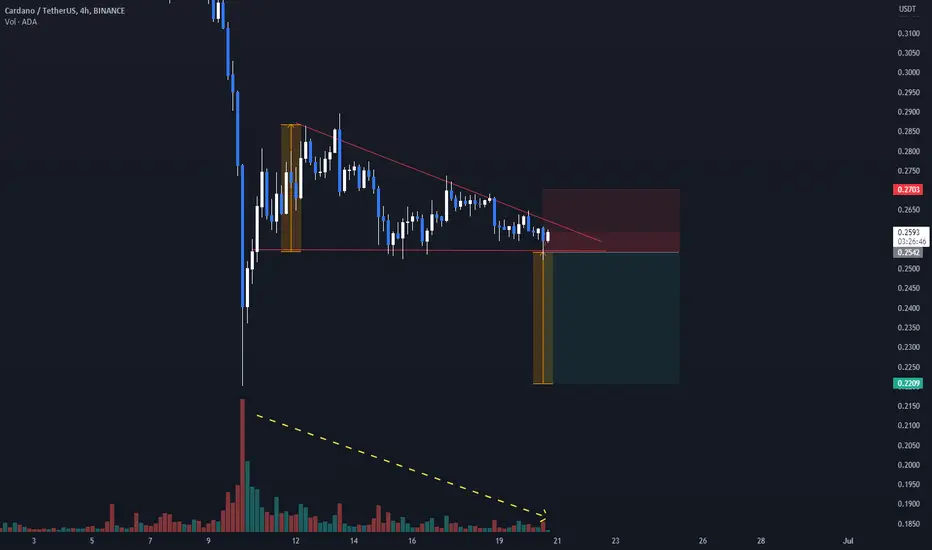
Cardano is currently forming a descending triangle pattern, which is often seen as a bearish continuation signal.
The price is forming lower highs and repeatedly testing a horizontal support level. In this pattern, the breakout tends to happen downwards, with a likelihood of around 64%.
To verify the pattern:
Now it is time to look for a breakout below the support level on significant volume. However, remain cautious of false intrabar breakouts that may occur.
The price is forming lower highs and repeatedly testing a horizontal support level. In this pattern, the breakout tends to happen downwards, with a likelihood of around 64%.
To verify the pattern:
- Diminishing volume
- Multiple touches on both trendlines
- Downward upper trendline
Now it is time to look for a breakout below the support level on significant volume. However, remain cautious of false intrabar breakouts that may occur.
Trade closed: stop reached
Innovative all-in-one trading and backtesting platform
cleo.finance
Test trading strategies on crypto, stocks, indices, forex with decades of 1-min data.
cleo.finance
Test trading strategies on crypto, stocks, indices, forex with decades of 1-min data.
Disclaimer
The information and publications are not meant to be, and do not constitute, financial, investment, trading, or other types of advice or recommendations supplied or endorsed by TradingView. Read more in the Terms of Use.