GOLD → It all depends on NFP and Powell....FX:XAUUSD got shaken by 600 pips on both sides. Technically, after such a move the price may go into consolidation, but the near-term outlook will depend on NFP and Powell.
Gold hit a high of 3168 and went into correction. President Trump's imposed duties on imports from China (up to 54%) and other countries caused a sharp drop in the dollar and bond yields, reinforcing expectations of a Fed rate cut. Traders turned to profit-taking, which led to a correction. Now the market is waiting for the NFP report and Powell's speech. Weak data may return the upward momentum to gold, especially if the dovish rate expectations are confirmed. However, volatility may persist after the publication, given the impact of Friday's flows and Powell's speech
Resistance levels: 3107, 3116, 3135
Support levels: 3086, 3067, 3055
Technically, it is difficult to determine a clear place from where to expect a move as there is news ahead (NFP, Powell's speech). But based on the falling dollar and high economic risks, we can bet on the continuation of the price growth from one of the mentioned support levels: 3086, 3067, 3055.
Exit from the channel and consolidation of the price above 3110 - 3116 will again attract increased interest in buying
Regards R. Linda!
Triangle

GOLD → Correction. Liquidity is the target. News aheadFX:XAUUSD on the background of yesterday's news reaches the target of 3166 and enters the phase of deep correction on the background of profit-taking. The level of economic risks is still high
Despite the pullback, the gold price retains much of its recent record high, thanks to rising risks of a global trade war and a US recession.
Gold corrects from record $3,168 but remains strong amid trade and recession risks. The correction is due to the following nuances: Profit taking ahead of key US jobs data. Waiting for jobless claims and services PMI.
But, Trump's new tariffs, a weaker dollar and lower bond yields are driving gold buying.
Resistance levels: 3116, 3135
Support levels: 3107, 3097
Against the background of high economic risks, falling dollar index, gold still has chances to continue its growth. False breakdown of support may give such a chance.
Regards R. Linda!

Newell Brands Stock Quote | Chart & Forecast SummaryKey Indicators On Trade Set Up In General
1. Push Set Up
2. Range Set up
3. Break & Retest Set Up
Notes On Session
# Newell Brands Stock Quote
- Double Formation
* (EMA Settings)) | Completed Survey
* 9.50 USD & Area Of Value | Subdivision 1
- Triple Formation
* (Target Entry Or Gap Fill)) | Short Set Up | Subdivision 2
* (TP1) | Subdivision 3
* Daily Time Frame | Trend Settings Condition
- (Hypothesis On Entry Bias)) | Logarithmic Settings
- Position On A 1.5RR
* Stop Loss At 7.00 USD
* Entry At 6.00 USD
* Take Profit At 5.00 USD
* (Ranging Argument)) & Pattern Confirmation
* Ongoing Entry & (Neutral Area))
Active Sessions On Relevant Range & Elemented Probabilities;
European-Session(Upwards) - East Coast-Session(Downwards) - Asian-Session(Ranging)
Conclusion | Trade Plan Execution & Risk Management On Demand;
Overall Consensus | Sell

Triangle Chart Patterns: How to Identify and Trade ThemTriangle Chart Patterns: How to Identify and Trade Them
Triangle chart patterns are essential tools in technical analysis, helping traders identify potential trend continuations. These formations build as the price consolidates between converging trendlines, signalling an upcoming move in the market. In this article, we’ll explore the three types of triangle patterns—symmetrical, ascending, and descending—and how traders use them to analyse price movements.
What Are Triangle Chart Patterns?
Triangle chart patterns are a common tool used to understand price movements in the market. These patterns form when the price of an asset moves within two converging trendlines, creating a triangle shape on a chart. The lines represent support and resistance levels, and as they get closer together, it signals a potential breakout in one direction.
Symmetrical, ascending, and descending are three types of triangle patterns. Each of these patterns reflects a different market sentiment, with symmetrical triangles showing indecision, ascending triangles suggesting a bullish bias, and descending triangles hinting at bearish momentum. These formations are useful because they help traders spot potential breakouts, where the price might move sharply up or down after a period of consolidation.
It’s important to note that triangles and wedge patterns are similar but not the same. Both patterns involve converging trendlines, but wedges tend to slope upward or downward. Triangles, on the other hand, either feature one horizontal trendline and a sloping trendline or two sloping trendlines at roughly the same angle.
Below, we’ll cover the three triangle types. If you’d like to follow along, head over to FXOpen and TradingView to get started with real-time charts.
Symmetrical Triangle
The symmetrical triangle is a popular chart pattern that shows up when the price of an asset starts consolidating within a tighter range. Unlike other triangle patterns, it doesn’t lean heavily in either direction—bullish or bearish—making it a neutral signal. It forms when buyers and sellers are in a bit of a standoff, with no clear trend in sight. However, this period of indecision often leads to a significant move once the price breaks out of the pattern.
What Does It Look Like?
- Two converging trendlines;
- One sloping down from the highs (resistance);
- One sloping up from the lows (support);
- The price oscillates between these two lines, forming lower highs and higher lows;
- The formation narrows as the lines get closer together, creating a point of breakout.
What Does It Indicate?
A symmetrical triangle pattern indicates a period of indecision in the market. Buyers and sellers are evenly matched, causing the price to move within a narrowing range. As it gets smaller, the pressure builds, and the price is likely to break out either up or down. Since the formation is neutral, the breakout could occur in either direction, and traders wait for this moment to see where the market is heading.
How Do Traders Use It?
Traders typically watch for a breakout from the symmetrical triangle to signal the next significant price movement. They often look for an increase in trading volume alongside the breakout, as this can confirm the strength of the move. In most cases, it’s used as a signal for potential price continuation. However, some traders see it as a reversal indicator, depending on what the preceding trend looks like.
Ascending Triangle
An ascending triangle is a bullish triangle pattern that’s often looked for when analysing potential price breakouts. It usually forms during an uptrend but may also appear in a downtrend. It suggests that buyers are becoming more aggressive, while sellers are struggling to push the price lower, creating a situation where the market might break upwards.
What Does It Look Like?
- A horizontal resistance line at the top (price struggles to break above this level);
A rising trendline at the bottom, connecting higher lows (buyers are stepping in earlier each time);
- The price moves between these two lines, creating a triangle shape;
- The formation narrows over time, putting pressure on the resistance level.
What Does It Indicate?
An ascending triangle pattern signals that buyers are gaining control. While the price keeps hitting a ceiling (resistance), the higher lows show that the market’s buying pressure is increasing. This often leads to a breakout above the resistance level, where the price can make a significant upward move. Traders usually see this formation as a sign that the market is primed for a continuation of the current uptrend. However, sometimes it can appear in a downtrend and signal a trend reversal.
How Do Traders Use It?
Traders typically use the ascending triangle to spot potential breakouts above the resistance level. When the price finally moves and closes above this line, it’s seen as confirmation that the upward trend is continuing. Many also pay close attention to the trading volume during this breakout—rising volume can confirm that the breakout is genuine.
In some cases, the price may break through the resistance quickly, while in others, it could take time before the upward move happens. There may also be false breakouts before the true bullish move occurs, with the price typically closing below resistance.
Descending Triangle
A descending triangle is a bearish chart pattern that signals potential downward movement in the market. It typically forms during a downtrend but can also appear in an uptrend. It shows that sellers are becoming more dominant, while buyers are struggling to push the price higher, which could lead to a breakdown below a key support level.
What Does It Look Like?
- A horizontal support line at the bottom (price struggles to break below this level);
- A descending trendline at the top, connecting lower highs (sellers are pushing the price down);
- The price moves between these two lines, creating a triangle shape;
- The formation narrows over time, with the pressure building on the support level.
What Does It Indicate?
A descending triangle chart pattern suggests that sellers are in control. While the price holds at the support level, the series of lower highs shows that selling pressure is increasing. This often leads to a breakdown below the support line, where the price might experience a sharp decline. Traders see the formation as a bearish signal, indicating that the market could continue its downward trend.
How Do Traders Use It?
Traders typically use the descending triangle to identify potential breakdowns below the support level. When the price falls and closes below this line, it’s considered confirmation that the sellers have taken over and that further downside movement could follow.
Similar to other triangle patterns, it’s common to watch for a rise in trading volume during the breakdown, as it can confirm the strength of the move. It’s also possible to see false breakouts below the support level when the price closes back inside the pattern almost immediately.
How Traders Use Triangle Patterns in Technical Analysis
These patterns are just one piece of the puzzle in technical analysis, but they can offer us valuable insights when used correctly.
Triangle Pattern Trading: Entry, Stop-Loss, and Profit Targets
Entry Points
Traders typically wait for a confirmed breakout from the triangle formation’s boundaries before entering a trade. For ascending triangles, this means watching for the price to break above the upper trendline (resistance), while for descending triangles, they look for a breakdown below the lower trendline (support). In a symmetrical triangle, the breakout may be in either direction, usually informed by the broader market trend.
The entry is often confirmed by a closing candle above or below these key levels to reduce the risk of false breakouts.
Stop-Loss Placement
Stop-loss orders are crucial here. For ascending triangles, stop losses might be placed just below the last swing low, while for descending triangles, they might be set just above the recent swing high. In the case of symmetrical triangles, traders often place the stop-loss just outside the formation’s apex.
Profit Targets
To set profit targets, traders typically use the triangle's height (the distance between the highest and lowest points). This height is then projected from the breakout point, offering a realistic target for the trade. For example, if a triangle stock pattern’s height is $10 and the breakout occurs at $50, the target would be $60 for a bullish move.
Combining with Market Context
Triangles may become more reliable when considered in the context of the broader market environment. Traders don’t just look at the pattern in isolation—they analyse the prevailing trend, market sentiment, and even macroeconomic factors to gauge whether a breakout aligns with the larger market movement. For instance, an ascending formation in a strong uptrend adds confidence to the idea of a bullish breakout.
Using Other Indicators for Confirmation
While triangles provide a useful framework, they’re usually combined with other technical indicators for confirmation. Traders often align triangles with volumes, moving averages, or momentum indicators to assess whether the breakout has strong support behind it. For instance, a breakout confirmed by high volume or a moving average crossover might add confluence to the trade.
Limitations and Considerations of Triangle Patterns
Triangles are useful tools in technical analysis, but they come with limitations and important considerations. While they can signal potential breakouts, it’s essential to approach them cautiously.
- False Breakouts: Triangles often experience false breakouts, where the price briefly moves beyond the trendline but quickly reverses. This may trap traders in unfavourable positions.
- Subjectivity: These formations are open to interpretation. Different people may draw trendlines slightly differently, leading to varying conclusions about where the breakout occurs.
- Need for Confirmation: Relying solely on patterns can be risky. They may work better when combined with other indicators, such as volume or moving averages, to confirm the trend direction.
- Market Conditions: In volatile or news-driven markets, chart patterns may not behave as expected, reducing their reliability. They may provide false signals or lose significance in these situations.
The Bottom Line
Triangle chart patterns are popular tools among those looking to analyse market movements and potential breakouts. Whether it’s a symmetrical, ascending, or descending triangle, these patterns provide valuable insights into price consolidation and future trends. While no pattern guarantees a winning trade, combining triangles with other indicators may improve market analysis.
Ready to apply your knowledge? Open an FXOpen account to explore chart patterns in more than 700 live markets and take advantage of our low-cost, high-speed trading environment backed by advanced trading platforms.
FAQ
What Is a Triangle Chart Pattern?
A triangle chart is a pattern in technical analysis that forms when the price of an asset moves between converging trendlines, creating a triangle shape on a price chart. They typically signal a period of consolidation before a strong potential breakout in price.
What Are the Patterns of Triangles?
There are three main types of triangles in chart patterns: symmetrical, ascending, and descending. Symmetrical triangles indicate indecision in the market while ascending triangles are often bullish, and descending triangles tend to be bearish.
How to Trade a Triangle?
Traders typically wait for a confirmed breakout from the triangle’s trendlines. According to theory, entry points are based on a breakout above resistance or below support, with stop-loss orders placed just outside the triangle. Profit targets are often set based on the height (the distance between the highest and lowest points) of the pattern.
What Is the Triangle Pattern Strategy?
The triangle pattern strategy involves waiting for a breakout and using the formation’s height to set profit targets. It’s combined with tools like volume, moving averages, and momentum indicators to confirm the move and avoid false breakouts.
Is the Triangle Pattern Bullish or Bearish?
They can be both bullish and bearish. Ascending triangles are generally seen before a bullish movement, descending triangles are bearish, and symmetrical triangles can be either.
This article represents the opinion of the Companies operating under the FXOpen brand only. It is not to be construed as an offer, solicitation, or recommendation with respect to products and services provided by the Companies operating under the FXOpen brand, nor is it to be considered financial advice.

Oil in a multi-week declining triangle patternPYTH:USOILSPOT
Oil has been in a multi-week declining triangle pattern, lasting over 2 years so far, which will eventually break to the downside. When it does, the price target should be around $35 USD. Which is calculated subtracting the width of the triangle from the base of the triangle.
When? Probably when we have a stock market crash, which could be soon. Fundamentally speaking, a global recession should reduce global demand for crude oil. Also, a resolution of the Ukraine-Rusia conflict should increase global supply of crude oil.
Good luck to you

Gold Price Action Alert: Bearish Breakdown AheadGold is consolidating within a Triangle Pattern on the 30-minute timeframe, signaling potential volatility. A confirmed breakdown below the support level could trigger a strong bearish move toward the $2,990 target.
Key Levels:
Resistance: $3,110 - $3,147
Support: $3,098 - $3,055
Target: $2,994
Watch for a decisive breakout and volume confirmation before entering a trade. Stay cautious and manage risk accordingly!
Must Support Me Share My Idea With Your Firends Mention Your Feed back Comment Section

GBPCAD bearish view
OANDA:GBPCAD whats next?, we are have two times bounce on trend line,
currently on D is visible DESCENDING TRIANGL,
in triangl we have RECTANGLE PATTERN 4h which is breaked,
below rectangle pattern we have on lower TF better visible BEARISH FLAG pattern 1h (violet doted), which currently looks breaked,
here expecting bearish push now till next trend zone.
SUP zone: 1.85000
RES zone: 1.82250, 1.81600

XRP could be about to drop 20% XRP is under pressure as the global trade war escalates, with rising US tariffs fueling fears of inflation and recession. A break below 194.62 could trigger a major downside move, supported by a bearish technical setup.
This content is not directed to residents of the EU or UK. Any opinions, news, research, analyses, prices or other information contained on this website is provided as general market commentary and does not constitute investment advice. ThinkMarkets will not accept liability for any loss or damage including, without limitation, to any loss of profit which may arise directly or indirectly from use of or reliance on such information

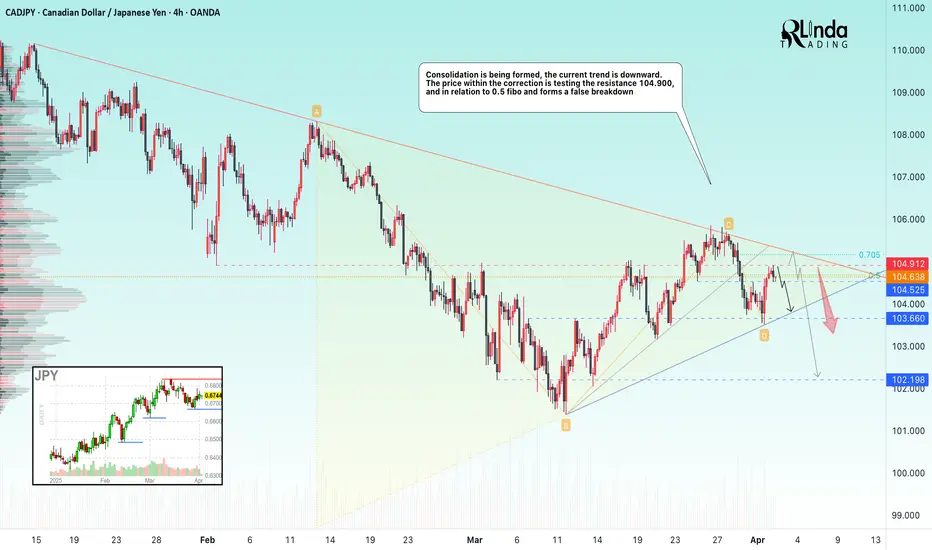
CADJPY → Consolidation before the news. DowntrendFX:CADJPY continues to forge a downtrend, but within the current movement a symmetrical triangle of accumulative nature is forming
The currency pair may continue its decline due to the strengthening of the Japanese Yen, while the Canadian is consolidating in a narrow range.
The situation may be accelerated by today's news, namely Trump's speech, where he may announce new tariff measures.
Technically, the price is correcting after the false break of 103.56, being below the previously broken upside support. Price is testing key resistance at 104.90, and against 0.5 Fibo is forming a false breakout. A consolidation below 104.69, a break of 104.525 could trigger further decline.
Resistance levels: 104.900, 105.36, 105.74
Support levels: 104.525, 103.56
There are important news ahead, high volatility is possible, especially at the moment of Trump's speech, which may set a medium-term tone in the market.
The currency pair is in consolidation on the background of the downtrend and the priority is to expect a continuation of the fall
Regards R. Linda!

ICID Egypt - A bullish long-term patternWeekly chart,
The stock EGX:ICID is trading inside a symmetrical triangle pattern between Support and Resistance lines (S and R)
The technical indicator RSI can be seen as drawing the same pattern (waiting for crossing up the R RSI line as a confirmation).
MACD is crossing up its signal line.. However, it is still technically negative.
So, I can expect a new bullish movement towards the Resistance line (at around 4.45)
Crossing up the R line and trading above it for 3 weeks - with high volume, the long term target will be 7.45
NOTE: Consider a near profit protection / stop loss level for this stock, as it is volatile and impulsive!

Expect EURUSD two way price action now! Intraday Update: The EURUSD has hit the 1.1100 level, going as high as 1.1146 and surpassing the long term trend line of 18yrs near 1.6000. This is a big resistance, expect two way price action around these levels.

Platinum Price Analysis: Breakout Strategy and Market OutlookIn this video, we take a look at platinum prices following a request from a reader. Despite a brief breakout, the price hasn't risen as expected and may be morphing into a classic triangle pattern. The best strategy now is probably to wait for a triple top to form before potentially trading a breakout. We also discuss different strategies, including trading within the pattern itself.
This content is not directed to residents of the EU or UK. Any opinions, news, research, analyses, prices or other information contained on this website is provided as general market commentary and does not constitute investment advice. ThinkMarkets will not accept liability for any loss or damage including, without limitation, to any loss of profit which may arise directly or indirectly from use of or reliance on such information

EURUSD Forms Bearish Triangle Ahead of Tariff AnnouncementAhead of today’s tariff announcement, EURUSD has formed a bearish triangle pattern. Among major instruments, EURUSD has been one of the least affected by tariff expectations in recent days. However, there is a short-term risk of a downside break. If the support near 1.0780 fails, EURUSD could retreat below 1.0750 before the announcement.
In any case, traders should be prepared for sharp intraday reversals due to potential rumors and positioning ahead of Trump's statement.

GOLD → The rally is intensifying. Growth after false breakdownFX:XAUUSD is breaking upwards and is trying to consolidate above the previous high of 3127 as part of a correction. This would be an ideal support for the bulls. The rally, on the background of political and geopolitical problems only intensifies
Tariff escalation pushes up gold demand. Trump rejected the idea of lowering tariffs and the Treasury Secretary named a list of 15 countries that fall under the new measures. This has caused the dollar to weaken and fears of stagflation to rise, boosting demand for gold as a protective asset.
Central banks and investors continue to build positions in gold, but corrections are possible before the tariffs announcement on April 2 and the release of U.S. economic data
Technically, we have a strong bullish trend, it is risky to sell, we are looking for strong areas or levels to buy. For example, if the price consolidates above 3127, or after a false breakdown of 3119 / 3111
Resistance levels: 3147, 3155, 3166
Support levels: 3127, 3119, 3111
Before the continuation of the growth there may be a correction to the key support areas to normalize the imbalance in the market as well as to capture the liquidity. Consolidation above the level after a false breakdown will be a good signal for growth.
But! News ahead and high volatility is possible!
Regards R. Linda!

PEB Pacific Edge NZBreakout and retest with bollinger band squeeze
I've posted multiple times about this stock and it is no doubt high risk and speculative,
but technically it is showing bullish signs in my opinion and looking ready to move
Full disclosure I've owned this stock for a while now, and looking at long term (years) play

abrdn Physical Gold ETF Quote | Chart & Forecast SummaryKey Indicators On Trade Set Up In General
1. Push Set Up
2. Range Set up
3. Break & Retest Set Up
Notes On Session
# abrdn Physical Gold ETF Quote
- Double Formation
* (EMA Settings)) | Completed Survey
* (Uptrend Argument)) At 26.00 USD | Subdivision 1
- Triple Formation
* Wave (3)) Feature Ongoing Set Up | Subdivision 2
* (TP1) | Subdivision 3
* Daily Time Frame | Trend Settings Condition
- (Hypothesis On Entry Bias)) | Logarithmic Settings
- Position On A 1.5RR
* Stop Loss At 28.00 USD
* Entry At 30.00 USD
* Take Profit At 32.00 USD
* (Uptrend Argument)) & Pattern Confirmation
* Ongoing Entry & (Neutral Area))
Active Sessions On Relevant Range & Elemented Probabilities;
European-Session(Upwards) - East Coast-Session(Downwards) - Asian-Session(Ranging)
Conclusion | Trade Plan Execution & Risk Management On Demand;
Overall Consensus | Buy

Euro may bounce up from support area to 1.0950 pointsHello traders, I want share with you my opinion about Euro. Analyzing the chart, we can observe how the price initially reached the support level that aligned with the buyer zone and broke through it. After that, the Euro moved into a wedge pattern, where it reversed near the resistance line and started to decline sharply toward the support line, forming a strong gap and breaking the support once again. Soon after, the price reversed direction and began to climb, breaking through the 1.0360 level again and rising to the resistance line of the wedge. A brief correction followed, bringing the price back down to the support level. From there, the market made a strong upward impulse, breaking out of the wedge and reaching the current support area. After the breakout, the price started moving within a triangle pattern. It broke above the 1.0785 level and climbed to the resistance line of the triangle. Then, a correction took place down to the support area, followed by a quick bounce back up to the resistance, from where the price recently started to decline. Given this structure, I expect the price to complete its correction at the support area and then bounce upward, breaking out of the triangle pattern. If this plays out, I anticipate further upward movement, with my target set at 1.0950 points. Please share this idea with your friends and click Boost 🚀

HelenP. I Bitcoin will break support level and continue to fallHi folks today I'm prepared for you Bitcoin analytics. Previously, Bitcoin was moving inside a triangle pattern, consistently reacting to the resistance zone between 88500 and 89300 points. Each time the price approached this level, sellers stepped in strongly, pushing the price back down. After multiple unsuccessful attempts to break this resistance, BTC ultimately lost bullish momentum, resulting in a decisive breakdown below the trend line. This breakout confirmed that sellers were taking control of the market. Following this bearish impulse, the price rapidly declined, eventually reaching the key support level at 81500, which coincided with the strong support zone between 81500 and 80800 points. At the moment, Bitcoin is trading near this support zone, showing a weak reaction and limited bullish interest, signaling continued bearish pressure. Considering the recent price action, the clear bearish breakout from the triangle, and the weak response at the current support, I expect that BTCUSDT will continue to decline and break the support level. That's why I set my goal at 79000 points. If you like my analytics you may support me with your like/comment ❤️

GBPUSD Forms Triangle as World Awaits Trump’s MoveGBPUSD is trading sideways in a triangle pattern as markets await potential US tariffs, which may be imposed tonight. The new tariffs will target multiple countries, making negotiations harder and most likely slowing the global economy. If tariffs are confirmed, a break below 1.2868 could trigger USD strength and GBPUSD downside. Alternatively, a break above 1.3015 might suggest USD weakness. Traders should also monitor EURUSD for confirmation.
This content is not directed to residents of the EU or UK. Any opinions, news, research, analyses, prices or other information contained on this website is provided as general market commentary and does not constitute investment advice. ThinkMarkets will not accept liability for any loss or damage including, without limitation, to any loss of profit which may arise directly or indirectly from use of or reliance on such information

AUDUSD Triangle Break Looms on Tariff RiskAUDUSD is trading inside a triangle pattern that's been forming for 83 days. A break below 0.6215 could trigger a 188-pip drop, with a 3.82 risk-reward setup. While the RBA held rates at 4.1%, upcoming US tariffs on Liberation Day may pressure the Aussie. Fundamentals and technicals align for a potential bearish move.
This content is not directed to residents of the EU or UK. Any opinions, news, research, analyses, prices or other information contained on this website is provided as general market commentary and does not constitute investment advice. ThinkMarkets will not accept liability for any loss or damage including, without limitation, to any loss of profit which may arise directly or indirectly from use of or reliance on such information

SD/Tether USD Cryptocurrency Quote | Chart & Forecast SummaryKey Indicators On Trade Set Up In General
1. Push Set Up
2. Range Set up
3. Break & Retest Set Up
Notes On Session
# SD / Tether USD Cryptocurrency Quote
- Double Formation
* (Downtrend Argument)) | Completed Survey
* 0.236 & 0 Retracement Area | Subdivision 1
- Triple Formation
* ((Triangle Structure)) | Ranging Set Up | Subdivision 2
* (TP1) | Subdivision 3
* Daily Time Frame | Trend Settings Condition
- (Hypothesis On Entry Bias)) | Regular Settings
- Position On A 1.5RR
* Stop Loss At 1.50 USDT
* Entry At 0.55 USDT
* Take Profit At Out Of Range Area USDT
* (Ranging Argument)) & Pattern Confirmation
* Ongoing Entry & (Neutral Area))
Active Sessions On Relevant Range & Elemented Probabilities;
European-Session(Upwards) - East Coast-Session(Downwards) - Asian-Session(Ranging)
Conclusion | Trade Plan Execution & Risk Management On Demand;
Overall Consensus | Sell

GOLD → Growing economic risks increase interest ↑FX:XAUUSD rallied aggressively due to high interest driven by rapidly rising economic risks, mainly related to Trump's tariffs. For selling, the risk is very high, with the stock and cryptocurrency market declines only adding to the interest in the metal
Markets are taking refuge in defensive assets amid WSJ reports of Trump's possible tariff hike of up to 20% for most US trading partners. This could trigger inflationary pressures and stagflation, weakening the dollar and bond yields, which supports the gold price.
This week all eyes are on Trump's speech on Wednesday, PMI, NonFarm Payrolls and Powell's speech
Technically, it is not worth selling now as it is high risk, and for buying we should wait for a correction to key support levels
Resistance levels: 3127
Support levels: 3103, 3091, 3085
We are not talking about any trend reversal now. It is worth waiting for a local correction or consolidation, the market will mark important levels, liquidity zones or imbalances against which you can build a trading strategy. Gold will continue to grow because of the strongly increasing risks.
Regards R. Linda!

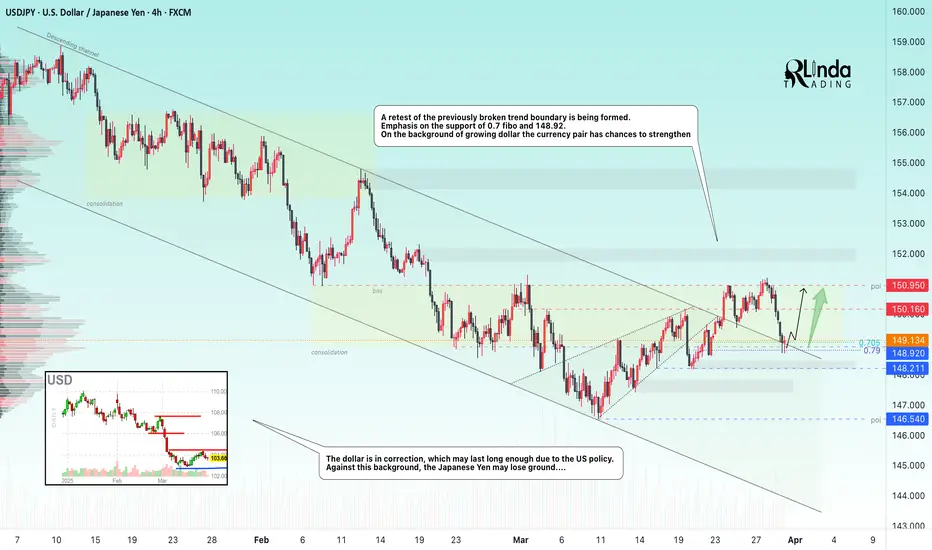
USDJPY → Key Level Retest. Attempt to change the trend FX:USDJPY in the correction phase is retesting the previously broken boundary of the downtrend. The market is trying to break the trend on the background of the dollar correction
The dollar is having a rather difficult life because of economic and geopolitical nuances regarding the USA, as well as high inflation. Against this background, the index may continue a deeper correction, as the rhetoric of interest rate cuts may be prolonged, which may put pressure on the markets.
The currency pair tried to overcome the downtrend resistance earlier and succeeded, but this is not enough for a trend change, it needs confirmation.
Support levels: 148.92, 148.21
Resistance levels: 150.16, 150.95
If the bulls hold the defense above 148.92 - 149.5, we have a good chance to catch a trend change. It will be the readiness to go to the resistance of 150.16 range, and the breakout of this level and price fixation above it will be the confirmation of the trend change
Regards R. Linda!