Setup
Measuring rule (target)
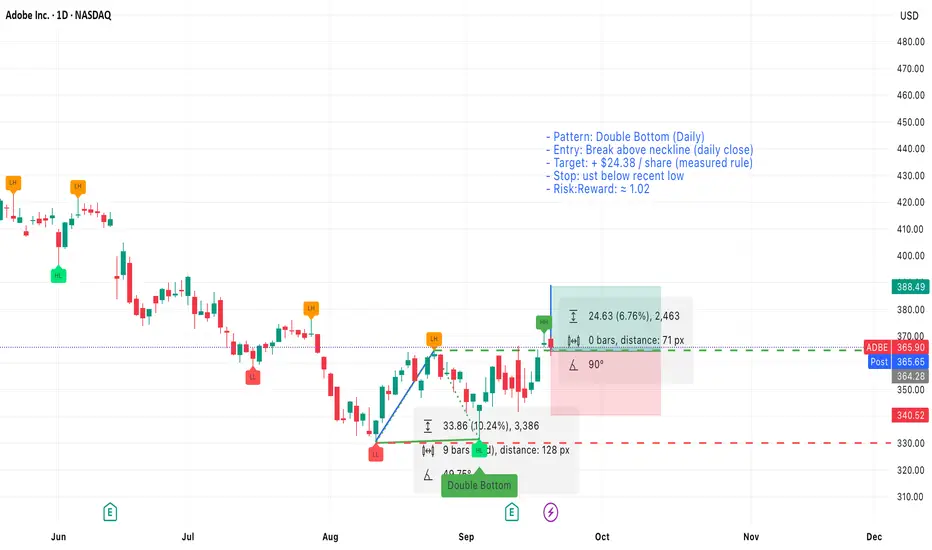
Measure the vertical distance from the bottoms to the neckline and add it to the breakout point. Using this method the measured target equals +$24.38 per share from the breakout.
Entry & trigger
- Enter long on a confirmed close above the neckline (daily close above neckline).
- If you prefer an earlier entry, a volume-backed intraday break above the neckline can be used, but prefer a daily close for confirmation.
Stop loss
- Place stop loss just below the recent low (the second bottom). Use a few cents/pips buffer below that low to avoid noise.
Position sizing & risk
- Risk per share = entry price − stop loss price.
- With the stop placed just below the recent low, risk per share is small and gives a risk/reward ratio ≈ 1.02.
Given the measured target of +$24.38, ensure your entry and stop sizing produce the stated R:R — example calculations below.
Notes & trade management
- Prefer a daily close above the neckline with increased volume for higher probability.
- If price returns to retest the neckline, consider adding only if support holds and risk remains acceptable.
- Trail stop to breakeven after a significant portion of the measured move is achieved (for example, after +50% of the $24.38 move).
- Pattern: Double bottom on the daily chart with two clear lows and a visible neckline.
- Timeframe: Daily
Measuring rule (target)
Measure the vertical distance from the bottoms to the neckline and add it to the breakout point. Using this method the measured target equals +$24.38 per share from the breakout.
Entry & trigger
- Enter long on a confirmed close above the neckline (daily close above neckline).
- If you prefer an earlier entry, a volume-backed intraday break above the neckline can be used, but prefer a daily close for confirmation.
Stop loss
- Place stop loss just below the recent low (the second bottom). Use a few cents/pips buffer below that low to avoid noise.
Position sizing & risk
- Risk per share = entry price − stop loss price.
- With the stop placed just below the recent low, risk per share is small and gives a risk/reward ratio ≈ 1.02.
Given the measured target of +$24.38, ensure your entry and stop sizing produce the stated R:R — example calculations below.
Notes & trade management
- Prefer a daily close above the neckline with increased volume for higher probability.
- If price returns to retest the neckline, consider adding only if support holds and risk remains acceptable.
- Trail stop to breakeven after a significant portion of the measured move is achieved (for example, after +50% of the $24.38 move).
Related publications
Disclaimer
The information and publications are not meant to be, and do not constitute, financial, investment, trading, or other types of advice or recommendations supplied or endorsed by TradingView. Read more in the Terms of Use.
Related publications
Disclaimer
The information and publications are not meant to be, and do not constitute, financial, investment, trading, or other types of advice or recommendations supplied or endorsed by TradingView. Read more in the Terms of Use.