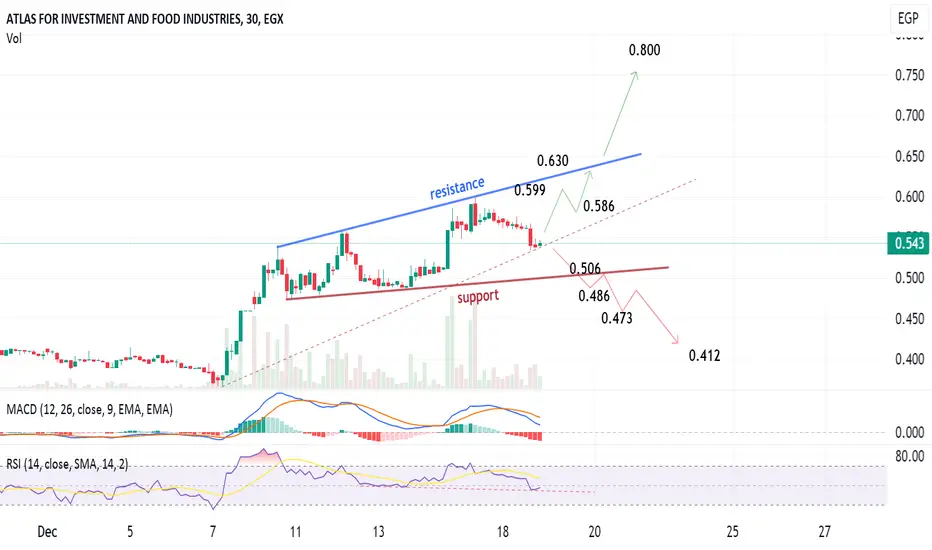
30-min chart, AIFI is trading in a critical level, where it can rebound from the current level to test resistance (BLUE), or go downwards to test the support line (RED)
My view is more positive (upwards)..
Some important price levels of resistance and support are shown on the chart for monitoring.
Above resistance: target 0.800
Below support: target 0.412
My view is more positive (upwards)..
Some important price levels of resistance and support are shown on the chart for monitoring.
Above resistance: target 0.800
Below support: target 0.412
Trade closed: stop reached
Related publications
Disclaimer
The information and publications are not meant to be, and do not constitute, financial, investment, trading, or other types of advice or recommendations supplied or endorsed by TradingView. Read more in the Terms of Use.
Related publications
Disclaimer
The information and publications are not meant to be, and do not constitute, financial, investment, trading, or other types of advice or recommendations supplied or endorsed by TradingView. Read more in the Terms of Use.