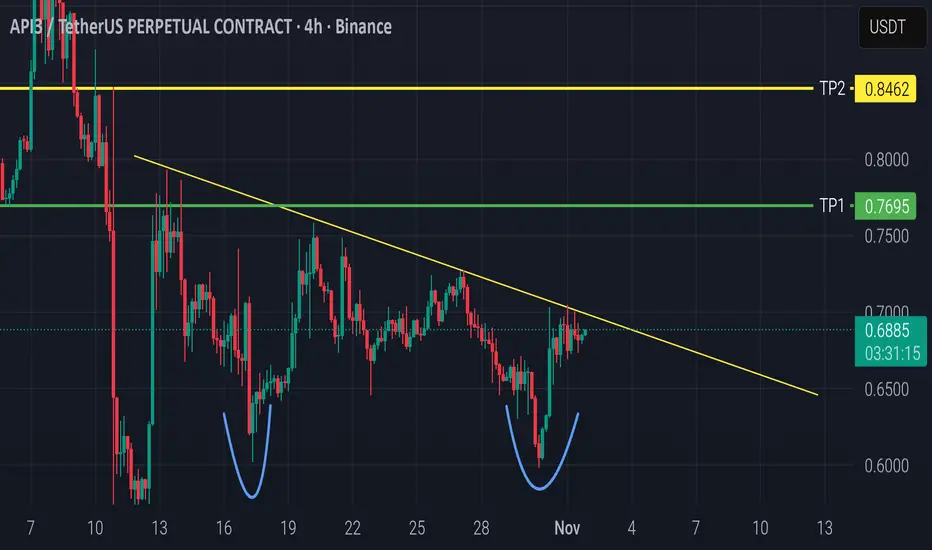
The chart shows a clear Double Bottom pattern around the 0.60 zone, indicating a potential bullish reversal.
Price is now testing the descending trendline (neckline), and a confirmed 4H candle close above 0.69 with strong volume could trigger a breakout move.
🎯 Targets:
TP1: 0.7412
TP2: 0.8462
🛡️ Stop Loss: Below 0.67 or the previous low.
Volume is increasing, supporting the potential breakout — so entry can be considered now if volume keeps rising, or after a retest of the trendline for safer confirmation.
#API3USDT #Crypto #TradingView #TechnicalAnalysis #DoubleBottom #TrendlineBreakout
Disclaimer
The information and publications are not meant to be, and do not constitute, financial, investment, trading, or other types of advice or recommendations supplied or endorsed by TradingView. Read more in the Terms of Use.
Disclaimer
The information and publications are not meant to be, and do not constitute, financial, investment, trading, or other types of advice or recommendations supplied or endorsed by TradingView. Read more in the Terms of Use.