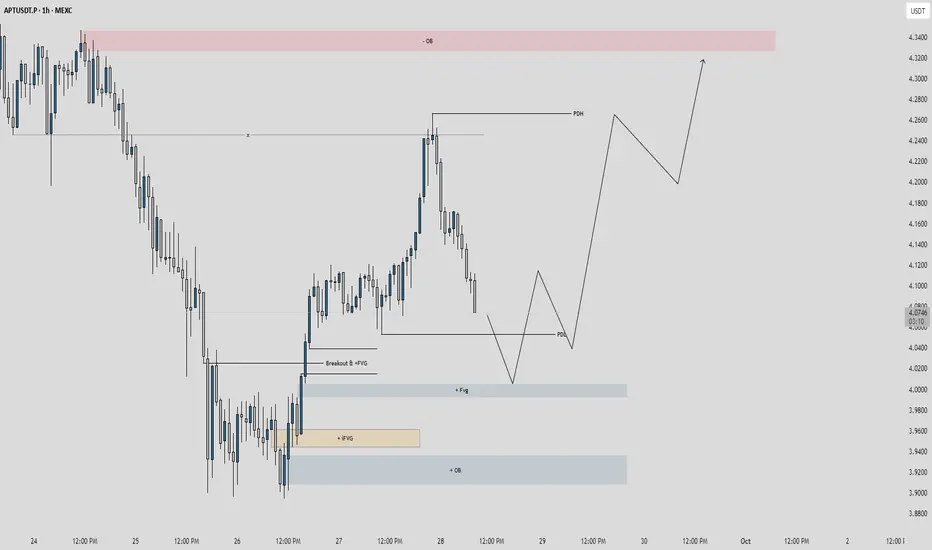
Price Action: Price broke above PDH at 4.2800 on Sep 28, showing bullish momentum, but pulled back to test support around 4.0813 (PDL).
Key Levels:
Resistance: 4.3800 (-OB, overbought zone).
Support: 4.0813 (PDL) and 4.0000 (+QB).
Zones:
Breakout +FVG: 4.0813-4.1000 (potential retest zone).
Inverted +IFVG: 3.9400-3.9600 (deeper support).
Quarter Back (+QB): 4.0000.
Trend: Bullish breakout above 4.2800, currently correcting. A hold above 4.0813 could resume the uptrend.
Long if price holds 4.0813 with confirmation target 4.2800, stop loss below 4.0600.
Trade closed: target reached
Disclaimer
The information and publications are not meant to be, and do not constitute, financial, investment, trading, or other types of advice or recommendations supplied or endorsed by TradingView. Read more in the Terms of Use.
Disclaimer
The information and publications are not meant to be, and do not constitute, financial, investment, trading, or other types of advice or recommendations supplied or endorsed by TradingView. Read more in the Terms of Use.