☃️ Welcome to the cryptos winter , I hope you’ve started your day well.
⏰ We’re analyzing APT on the 1-Day timeframe .
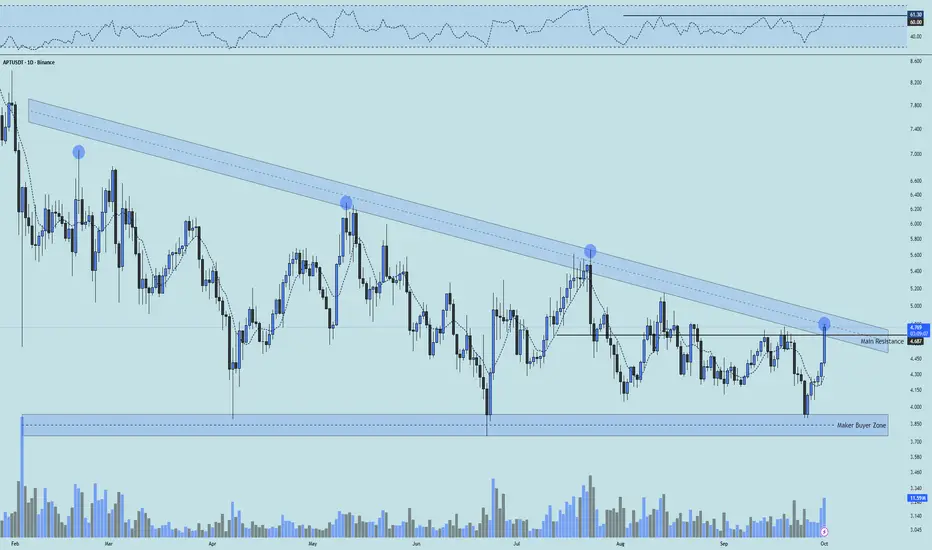
👀 On the daily timeframe for Aptos, we can see it's ranked 36 on CoinMarketCap, and its 24h trading volume is around 16% of its total market cap. This indicates heavy activity and high liquidity. APT is moving inside a triangular range, currently consolidating at the end of this triangle, with signs of a potential breakout. If it breaks and confirms above this structure, the coin could begin a price recovery after 240 days of ranging and selling pressure, pushing toward its higher resistances. The key resistance right now is at $4.7, and a confirmed breakout above this level can send it toward its next resistance zones.
🧮 Looking at the RSI oscillator, it was ranging inside a box between the 30–60 zone. On the 4th touch, the top of the box was broken and RSI crossed above 60. Our main RSI confirmation comes with a daily candle close above the $4.7 resistance, along with RSI stabilizing above 60, which would trigger increased volume, volatility, and even push RSI toward the overbought zone.
🕯 The size, volume, and number of recent green candles after the last touch of the maker-buyer zone have noticeably increased, with 6 bullish candles pushing the price toward the key resistance. Market participants in crypto are waiting to see the reaction here. From a time perspective, the coin spent 240 days in a descending range and completed a proper correction. Now that it's in the final squeeze phase, buying volume has increased well, and if the momentum continues, the coin could see a strong price rally.
 💸 On the
 APTBTC pair, we can see it's at the end of the triangle and has almost pushed above its resistance with a whale candle, though volume is still relatively low. If the price stabilizes above the marked resistance on this pair and we also see rising volume on the USDT pair, a significant outperformance against Bitcoin is likely. This could attract whale attention and encourage rotation from BTC into APT.
🧠 For positioning on Aptos, entering with a reasonable risk makes sense, especially since after 240 days it's showing signs of forming a higher low and potentially a higher high. With a breakout above $4.7, the coin can continue toward its upper resistance levels.
↗️ Long Scenario: Breakout and confirmation above $4.7, with RSI stabilizing above the 60 zone as seen in the analysis, along with a confirmed breakout and support hold on the BTC pair. With increasing long volume and a completed pullback, entering on a secure higher low in multi-timeframe structure would be valid.
📉 Short Scenario (Risky): It's almost unlikely that the coin drops significantly from current levels, but if it does, losing the maker-buyer zone on both USDT and BTC pairs could trigger a deep correction with maximum selling pressure. Keep in mind, short positions in this phase of market compression breakouts are generally illogical since price reversals are very likely in these trends.
❤️ Disclaimer : This analysis is purely based on my personal opinion and I only trade if the stated triggers are activated .
⏰ We’re analyzing APT on the 1-Day timeframe .
👀 On the daily timeframe for Aptos, we can see it's ranked 36 on CoinMarketCap, and its 24h trading volume is around 16% of its total market cap. This indicates heavy activity and high liquidity. APT is moving inside a triangular range, currently consolidating at the end of this triangle, with signs of a potential breakout. If it breaks and confirms above this structure, the coin could begin a price recovery after 240 days of ranging and selling pressure, pushing toward its higher resistances. The key resistance right now is at $4.7, and a confirmed breakout above this level can send it toward its next resistance zones.
🧮 Looking at the RSI oscillator, it was ranging inside a box between the 30–60 zone. On the 4th touch, the top of the box was broken and RSI crossed above 60. Our main RSI confirmation comes with a daily candle close above the $4.7 resistance, along with RSI stabilizing above 60, which would trigger increased volume, volatility, and even push RSI toward the overbought zone.
🕯 The size, volume, and number of recent green candles after the last touch of the maker-buyer zone have noticeably increased, with 6 bullish candles pushing the price toward the key resistance. Market participants in crypto are waiting to see the reaction here. From a time perspective, the coin spent 240 days in a descending range and completed a proper correction. Now that it's in the final squeeze phase, buying volume has increased well, and if the momentum continues, the coin could see a strong price rally.
🧠 For positioning on Aptos, entering with a reasonable risk makes sense, especially since after 240 days it's showing signs of forming a higher low and potentially a higher high. With a breakout above $4.7, the coin can continue toward its upper resistance levels.
↗️ Long Scenario: Breakout and confirmation above $4.7, with RSI stabilizing above the 60 zone as seen in the analysis, along with a confirmed breakout and support hold on the BTC pair. With increasing long volume and a completed pullback, entering on a secure higher low in multi-timeframe structure would be valid.
📉 Short Scenario (Risky): It's almost unlikely that the coin drops significantly from current levels, but if it does, losing the maker-buyer zone on both USDT and BTC pairs could trigger a deep correction with maximum selling pressure. Keep in mind, short positions in this phase of market compression breakouts are generally illogical since price reversals are very likely in these trends.
❤️ Disclaimer : This analysis is purely based on my personal opinion and I only trade if the stated triggers are activated .
❄️ Join the Action Now ❄️
Telegram
t.me/CryptosWinter
Mexc
promote.mexc.com/r/HHAkF63P
Bitunix
bitunix.com/register?inviteCode=28r21f
Telegram
t.me/CryptosWinter
Mexc
promote.mexc.com/r/HHAkF63P
Bitunix
bitunix.com/register?inviteCode=28r21f
Related publications
Disclaimer
The information and publications are not meant to be, and do not constitute, financial, investment, trading, or other types of advice or recommendations supplied or endorsed by TradingView. Read more in the Terms of Use.