This analysis is an update of the analysis you see in the "Related publications" section
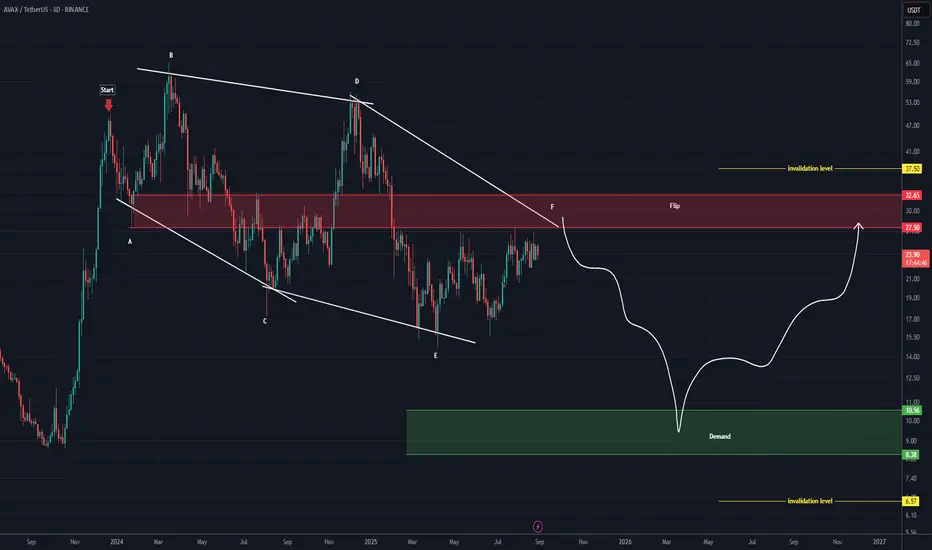
Before anything else, pay attention to the timeframe: it’s the 3-day timeframe.
The structure that AVAX is following is a large diametric, where wave F of this diametric is expected to end within the red-marked zone. After that, the price is anticipated to enter the bearish G wave.
Wave G could extend down to the main order block, which is the green-marked zone.
For both the bearish and bullish scenarios, the invalidation levels are marked on the chart. A daily candle closing above or below these levels will invalidate the respective outlook.
For risk management, please don't forget stop loss and capital management
Comment if you have any questions
Thank You
💎Join our Telegram channel for real-time crypto insights 👉 t.me/Behdark_EN
💎More charts. More insights. only on our Telegram:
Free membership: t.me/Behdark_EN
💎 Exclusive signals are only shared on our Telegram channel
💎More charts. More insights. only on our Telegram:
Free membership: t.me/Behdark_EN
💎 Exclusive signals are only shared on our Telegram channel
Related publications
Disclaimer
The information and publications are not meant to be, and do not constitute, financial, investment, trading, or other types of advice or recommendations supplied or endorsed by TradingView. Read more in the Terms of Use.