BITCOIN → Consolidation before the breakout. When do we go up?BINANCE:BTCUSD continues to consolidate, but within a strong bullish structure. The price is approaching the trigger, the breakout of which may provoke the formation of an upward impulse
Globally, the coin is still in the phase of realizing a global " cup and handle ", which I reminded one of the first back in August:
A good signal that hints that the growth is likely to continue is the fact that after a strong growth and testing 100K the price does not fall, but consolidates with gradually rising local lows, it is also worth paying attention to MA-50, which acts as a strong support. Within this consolidation we have clear zones, within which the price is trading and accumulating potential, and there is also a clear trigger, the breakout of which can provoke the continuation of growth (distribution).
But next week is the Fed meeting on December 17-18, and there may be short-term market manipulative reactions. Be careful
Resistance levels: 101.8K, 104.1K
Support levels: 98.9K, 94.15K
Technically, the focus is on 101.8 - 98.9. Consolidation is forming inside this channel. I do not exclude a chance of support retest in the format of a false breakdown before further growth. Another deep correction to the lower liquidity zone - 94.1K is also possible. But until the price breaks 101.8, bitcoin will not go up, and based on the chart, the event is close and the chance is high
Rate, share your opinion and questions, let's discuss what's going on with ★ BINANCE:BTCUSDT ;)
Regards R. Linda!
Wave Analysis

EURUSD // Back in the primary short trendWith the close on Thursday, the market entered into the primary expansion phase.
A countertrend break on the lower timeframes may push the price to the weekly zone again.
———
Stay grounded, stay present. 🏄🏼♂️
Your comments and support are appreciated! 👊🏼

NotcoinIn the previous analysis, we showed an important range that corrected exactly to that point and bounced back up from that area. Notcoin could see upward targets in the future.

MOASS: WC: 27.99 Target: 1800-2400 MOASS: 47k-100KTLDR:
BOOM!!!
Volume Point of Control (VPOC) is critical to watch as well
VPOC tracks the major waves in the wave cycle and will sit between major waves
VPOC and where it sits in relation to price, like VWAP, helps us track the progression of waves
Next move will take us to the 35-40 region
Price will then retrace back to the 28 region which is where we will see an EXPLOSION IN PRICE
That move back to 28 will be your last time, maybe ever, to get GME at anything near these levels
The next move after the retracement to 28 takes us to 70
After 70 comes CHEERS EVERYBODY!!!

Bitcoin Analysis ==>>Ready for Correction!!!Bitcoin ( BINANCE:BTCUSDT ) is moving in the Resistance zone($102,280-$101,000) . (We saw the fake break ).
According to the theory of Elliott waves , it seems that Bitcoin has succeeded in completing 5 impulsive waves , and we should wait for corrective waves .
Signs of the completion of the main wave 5 in the one-hour time frame:
1-BTC broke the Uptrend lines .
2- Shooting Star Candlestick Pattern formation
3- Regular Divergence(RD-) between Consecutive Peaks.
I expect Bitcoin to fall to at least the Support zone($99,600-$98,000) in the coming hours .
⚠️Note: If Bitcoin goes above $102,540, we should expect a new All-Time High(ATH).⚠️
⚠️Note: If the Support zone($99,600-$98,000) is broken, we should wait for Bitcoin to fall at least to $96,500.⚠️
Bitcoin Analyze (BTCUSDT), 1-hour time frame⏰.
🔔Be sure to follow the updated ideas.🔔
Do not forget to put Stop loss for your positions (For every position you want to open).
Please follow your strategy and updates; this is just my Idea, and I will gladly see your ideas in this post.
Please do not forget the ✅' like '✅ button 🙏😊 & Share it with your friends; thanks, and Trade safe.

Mastering the trading on US 30! it is more than just an idea!Hi, I hope you all are doing well
* The chart time frame on chart is 4H but all time frames were used on my analysis!
* We hit together in this bearish wave ,which I spoke about before it happens, three TPs (have a look on my last two ideas which I attached their links down for you to see) and now it is more complex than before and we need to mind something I will speak about it now.
* The overall big wave for US 30 is bullish and what we see in this bearish wave is just a big correction wave because the index is searching currently for its HL to settle on and return back to do another ATH and so on. That is the easy talk because the tough question now is what the index bias now and where could be that HL?!
* To answer this question you need to see that chart again now quickly and read what will come below and always keep looking step by step. I do want only to tell you targets! I want you to understand too.
* The index retraces from its ATH by the top yellow line, correct and lost 44735 already and I spoke a lot about the importance of that price as all that bearish wave happened because of that!
* Then index kept breaking supports levels on the way down and did not care except to the target which the whalers want to send the index too to gain the power again. All the candles at the free fall were on the left side of the purple downtrend line and could not break it so far because if it will be broken, will be the end of the bearish wave but obviously the index till now did not reach to its target!
* My TP2 on my last idea was at 43800 and I chose that price carefully and wisely and not further down as I expect a bullish retrace to happen from here at around 43800 or 43780 but to where it could go up to?!
* Do you see now the yellow square which I wrote next to it not a safe zone? because the top and the bottom lines of that square are acting as support and resistance zone from 43780 till 43970 this area is so beloved by the market whalers to give a feeling it will go down or up then it could work out with only by luck! because the correct decision to take is to refrain or avoid to set your entry in this area at all and to be patient UNTILL the price break through above or down than that yellow square!
* By going down, will send the index directly to 43435 which I said many times before that is the second most important price after 44735! and I said both those levels are game changer by all the means! losing them means further down moves like what happened with 44735 and settling and bounce up from will give the index the needed buy power back! 43435 is at the blue flag on the chart! where will be the TP of that idea ONLY if the index will continue to go down and close under by minimum 1h candle's body and not with a wick as it could retrace back before the closure of the candle then you would lose the trade!
* Now have a look on the three blue curved lines and see now where they are heading to?!
the first is at the 2HH which acts now as a strong support for index, the second and the third were the points where great bullish momentum started from. Now your your eyes started to see what I see ))
* Now then, have a look too on the red line I drew for you to understand that this line is acting as support or resistance, again it is not by luck that it is located at 43435 which is at the TP level!
* Then now have a look please on the bottom yellow line of the big rising channel where there is a very big chance still that index could go and touch that line too, but I am not sure yet about it. That is why the HL point will be when the index reaches the red pr the below yellow line ))
* Before that last but it is EXTREME important! For US 30 to continue the big overall bullish wave, the 4 HL CAN NOT BE at less level that 3HH but higher or at same level is also acceptable!
* Last thing! Guess what also, Do you think still that my Fib level of 38.20% will meet the index in the same point of when the index reaching to the yellow line is luck! nothing is by luck, that is the trading guys! and the beauty of it!!
* I did not put a second TP because I do not want to confuse you but you already know where that will be now ;)
I sat the idea on neutral not short or long! do not forget the yellow square, above it so will be bullish but down from it would be bearish and if it is meant to be bearish then you know the targets!
I think now your minds are telling you 100% bearish then because the puzzle is solved now)) and all make sense! Wait, nothing in the trading is called 100% but say to yourselves, that there is a condition if it happen so I will know what I will do and I will be patient for it because nothing is called 100% and no one is perfect!
Note!! My ideas are exclusive to myself only and is not regarded as an advice for traders or investors and are not more than personal thoughts which I just wanted to share with you all and I do hope they could help.
I am not selling any signals and I do not take money favour any trades recommendations. They are free of charge all lifelong but I keep the copy rights of them though to not be copied or shared or sold.

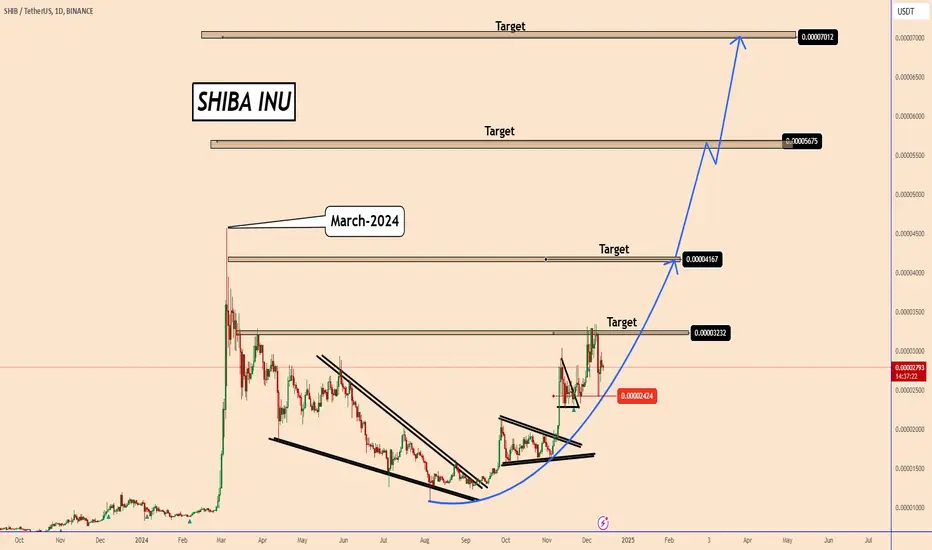
Shiba Inu Seen from Another PerspectiveShiba Inu Seen from Another Perspective
From our previous analysis, Shiba Inu reached our first target.
However, considering it is a meme coin, it didn't move like other altcoins and didn't follow the movements of other meme coins.
Now might be the time we see Shiba Inu in action.
Technical Analysis:
Shiba Inu is still bullish, and the price is rising in an oval trend, making higher highs on the daily chart. The bullish patterns are clear, and the price has faced strong support several times near 0.00002424.
It has been around this area for about one month, likely indicating an accumulation zone before a bigger wave begins.
You may find more details in the chart!
Thank you and Good Luck!
❤️PS: Please support with a like or comment if you find this analysis useful for your trading day❤️
BITCOIN // primary expansionTrends are bullish on every major timeframe, and the countertrend may break, triggered above the H4 breakdown.
If triggered, my target is 106k.
———
Stay grounded, stay present. 🏄🏼♂️
Your comments and support are appreciated! 👊🏼

THE TOP: Bitcoin is at its top. Enjoy.The fibs line up with the waves. We might be up for a fakeout then a massive dump.
Be careful and goodluck trading. Take profit and sit back. Dont lose everything back.

Small correction up and a drop for goldHi traders,
Last week XAUUSD tested the higher Daily FVG again and dropped.
This could be the start of the last C-wave (orange).
So next week we could see a small correction up and another drop to finish the (orange) A-B-C ZIgzag correction.
Or it turns out that the whole bigger correction was a Triangle (finishe before blue wave b) and we see the next impulsive wave up from here. Then you could trade longs after a correction down on a lower timeframe.
Let's see what price does and react.
Trade idea: My main idea is the first one.
So I would wait for a correction up and a change in orderflow to bearish to trade shorts.
If you want to see more from my analysis, please make sure to follow me, give a like and respectful comment.
This shared post is only my point of view on what could be the next move in this pair based on my analysis. I do not provide trade signals.
Don't be emotional, just trade!
Eduwave

ETHUSD Wave Analysis (neowave - Elliot)Ethereum is likely to move in the direction indicated on the chart. It is expected to complete wave (d) and may grow slightly further in the smaller wave d. Stay tuned for updates in the future.
I am not offering any trades at the moment.

Technical Analysis for #ADA/USDT:Technical Analysis for #ADA/USDT:
CRYPTOCAP:ADA The daily chart indicates the formation of a symmetrical triangle, suggesting a potential breakout in the bullish direction. The current price at $1.059 is near the lower support zone. Key support lies at $0.9168, presenting an ideal buying opportunity. Projected targets after the breakout are $1.4594, $1.7574, and $2.0387. Traders are advised to set a stop loss below $0.89 for risk management.

NOT daily update#NOT daily update :
not made a long term correction after its pumping after its airdrop and this correction is based on the elliot waves so i think the correction is over and the rising as wave 1 after that can confirm that after that made a sharp down spike as wave 2 now we are in the 3rd wave

BITCOIN COMING COLLAPSE 15.800/11,800 OCT 2026 LOW The Chart Posted Is that of a NON TANGIBLE ASSETS And has now followed The similar pattern in each of it bull market and bear markets since it has began in 2009 . In 2018 I called for a major top 19600 to 20380 That high was 19800 area and it followed the pattern of 1929 to a near perfect which called for a decline to 3400 the low was 3300 area . since this we have had clean and clear rallies in 5 waves up followed by ideal ABC declines and all have reached targets for the low within 2.7% and the next Bull phase . We are now near the End of the bull phase and a record of Leverage and Speculation and the creation of Derivatives and even more Leverage from 2 to 3 X times Now similar to The year of 1620 The peak in the Tulip mania . I have called for a final peak into the spiral turn we saw our first high on on time at 99600 . we are now near completed All sub divisions and bear cycles Points to a Low in mid Oct 2026 . The targets are for a 85 % decline at a MIN with the likelihood of a possible print o f8900/11,300 into this time frame . I also tend to see The Crypto market to lose over 90 % of the coins that are traded . Oct 2026 is the first low in the Great depression . All cycles are based on golden ratio and Natural Law of the 18.8 cycles Best of trades WAVETIMER

USDT Tether Dominance Overview: Scam Or Altseason?Hello, Skyrexians!
Today we are going to continue observe the charts which can be the evidences of potential altseason. Earlier we pointed out the Bitcoin dominance reversal and the potential impulsive wave 5 for altcoins dominance . Today we are going to look at the another very important chart of CRYPTOCAP:USDT.D to understand if we will see the altseason in the nearest future.
Let's take a look at the weekly time frame. Globally the chart is in huge uptrend, but last 2 years it is decreasing. We can count this dump as a major correction ABC in the super cycle. Waves A and B have been already printed. Wave B reached 0.61 Fibonacci of wave A, it can give us a great confidence that now USDT is in wave C. Moreover at the top of wave B our Bullish/Bearish Reversal Bar Indicator has printed the red dot, the huge bearish signal, as a result it's dumping now. As always, alerts from this indicator are automatically replicated on my accounts. You can find the information in our article on TradingView .
Wave C has the clear target between 1 and 1.61 Fibonacci extension levels of wave A. Now this zone is located inside the 1.55% and 2.77%. This is significant move which can cause altseason or this dump can be caused by some issues for Tether. Nobody knows, but finally there is a high chance that USDT is going to remain the position of the most popular stable coin.
Best regards,
Skyrexio Team
___________________________________________________________
Please, boost this article and subscribe our page if you like analysis!

GBPUSD - Nothing Can Stop It, It's All The Way Up!Here we have the monthly chart for GBPUSD.
GBPUSD 'recently' completed a major ending diagonal. We know this as it was a 5 wave pattern in the form of a wedge. Now that the bottom is in, we're expecting multiyear bullish price action.
Wave 1 can be an impulse or a leading diagonal. For GBPUSD, we are seeing a clear leading diagonal pattern = 5 waves.
We are anticipating one final move up to complete wave 1 and then we'll be seeing a wave 2 correction (as shown in the chart)
Trade Idea: Trading the 5th wave of the Leading Diagonal
- Watch for bullish price action to appear
- Confirmations such as trendline break or BOS can be used to gain an entry
- Once entered, put stops below wave 4
- Target: 1.36 (1,100pips)
Once wave 1 leading diagonal is complete, we'll be back with an update!
If this post gets enough engagement, we'll post lower timeframe charts.
Goodluck and as always, trade safe!

TESLA: Bearish Continuation is Highly Probable! Here is Why:
The charts are full of distraction, disturbance and are a graveyard of fear and greed which shall not cloud our judgement on the current state of affairs in the TESLA pair price action which suggests a high likelihood of a coming move down.
❤️ Please, support our work with like & comment! ❤️

A silver low here would strongly imply big bull breakoutBuilding more on the idea of a USD crash explained in previous ideas, here's the silver setup.
Silver has a pending butterfly reversal patten on it. Currently we have a 1.61 high and a pullback to 1.27.
From the perspective of USD bulls, the 1.61 high is encouraging but the 1.27 has to break - otherwise, failure of the butterfly is very likely. Failure of the butterfly most often leads to parabolic moves to the 2.20 and 2.61 fibs.
Here is this same setup flagging the rally after the election.
Bear trades did well from the 1.61 but you had to be locking in profits at the 1.27.
Same thing in BTC. Last short level In posted was the 1.61. Great trade with every single day being down after the entry, but you had to lock in profits at the 1.27.
If this trade is coming is silver, the implied move is around 25% directly up.

EURJPY Rises Anticipating BOJ Interest Rate DecisionEURJPY Rises Anticipating BOJ Interest Rate Decision
After struggling for three days without any clear direction, EURJPY began another bullish wave today.
The market is anticipating the BOJ interest rate decision scheduled for Thursday, December 19.
Considering BOJ comments showing hesitation to increase rates during this meeting.
This is a strong reason why we see all the XXXJPY pairs today rising again.
EURJPY may continue to rise during the coming days up to 162 and 163
You may find more details in the chart!
Thank you and Good Luck!
❤️PS: Please support with a like or comment if you find this analysis useful for your trading day❤️

Hbarusdt updatehello friends
As you can see in Chart, the wedge pattern is almost decided and you should wait for the failure and enter the trade after the pullback or now.
Of course, it is only a personal opinion and is not the basis of transactions.

NATGAS Will Explode! BUY!
My dear followers,
I analysed this chart on NATGAS and concluded the following:
The market is trading on 3.268 pivot level.
Bias - Bullish
Technical Indicators: Both Super Trend & Pivot HL indicate a highly probable Bullish continuation.
Target - 3.355
About Used Indicators:
A super-trend indicator is plotted on either above or below the closing price to signal a buy or sell. The indicator changes color, based on whether or not you should be buying. If the super-trend indicator moves below the closing price, the indicator turns green, and it signals an entry point or points to buy.
———————————
WISH YOU ALL LUCK

EURUSD: Market of Sellers
The price of EURUSD will most likely collapse soon enough, due to the supply beginning to exceed demand which we can see by looking at the chart of the pair.
❤️ Please, support our work with like & comment! ❤️

RDNT can fly !#RDNT made a down trend and after that made a break out this can be the 1st wave and the correction is the 2nd wave i think that the demand zone will be touched and after that can make a huge rise
