Cardano - Bullish Breakout! Can Bulls Finally Take Control? Cardano (ADA) has recently broken out of a prolonged bearish trend on the 4-hour chart, signaling a potential shift in market sentiment. This breakout suggests that bullish momentum could be building, paving the way for a move higher. The price action indicates that ADA may now target areas of confl
Key data points
No news here
Looks like there's nothing to report right now

ADA - Bearish Reversal Setup from Fair Value Gap🚀 ADAUSDT - 1H Chart Analysis 🚀
📊 Current Market Structure:
ADA is moving within a rising channel 📈, approaching a key resistance zone where a Fair Value Gap (FVG) is present. This area aligns with a significant Fibonacci retracement zone, making it a strong potential reversal point.
📌

ADA - Next Trade Setups to WatchADA’s been stuck in this sideways grind for a while, and the volume’s basically ghosting us. So, where’s it at, and where’s the next move? Let’s dig in.
ADA’s sitting at $0.6615 right now, trading below the yearly open at $0.8451 and the range’s sweet spot, the POC, at $0.7325. That tells me it’s l

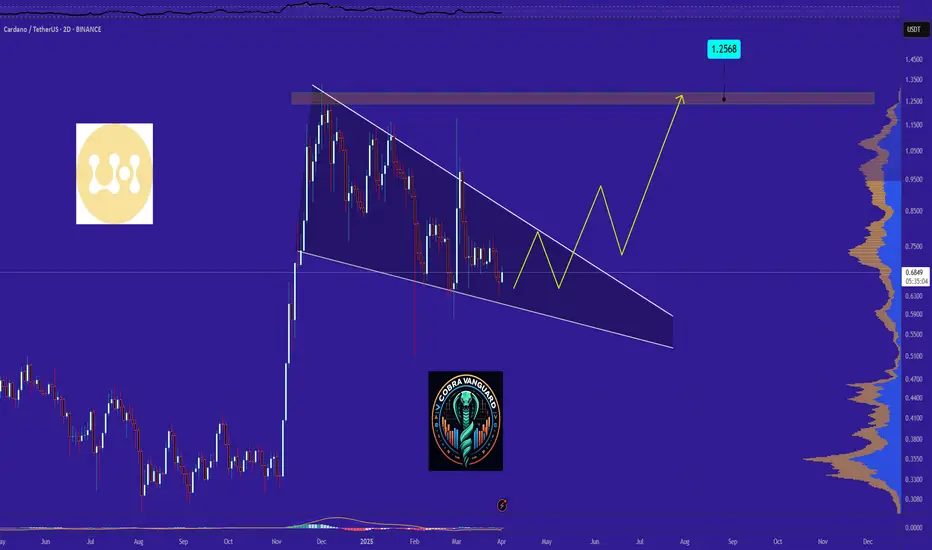
The last bullish chance of CARDANO in mid term!As you can see, the price has now formed an ascending wedge, which is promising. The price could rise to $1 after breaking this wedge...
Give me some energy !!
✨We spend hours finding potential opportunities and writing useful ideas, we would be happy if you support us.
Best regards CobraVanguard

Can we be optimistic that this will come true?( road to $1 )As you can see, the price has now formed an ascending wedge or ascending flag , which is promising. The price could rise to $1 after breaking this wedge...
Give me some energy !!
✨We spend hours finding potential opportunities and writing useful ideas, we would be happy if you support us.
Best rega
ADAUSDT from 0.50$ support heavy pump will lead ---> +200%As we can see price is now near strong support of 0.65$ and soon it can break to the downside and we are looking for more fall and correction to the 0.50$ support zone and after that start of next bull market and new high here for ADAUSDT.
DISCLAIMER: ((trade based on your own decision))
<<press li

Cardano (ADA) is on the verge of an 80% surge (1D)Despite all the positive news, it couldn’t maintain its bullish trend, as seasoned whales typically don't enter the market at the end of bullish waves.
The zone we’ve highlighted is where we believe whales will enter Cardano. Due to heavy buying pressure, the price could experience a 50% to 80% sur

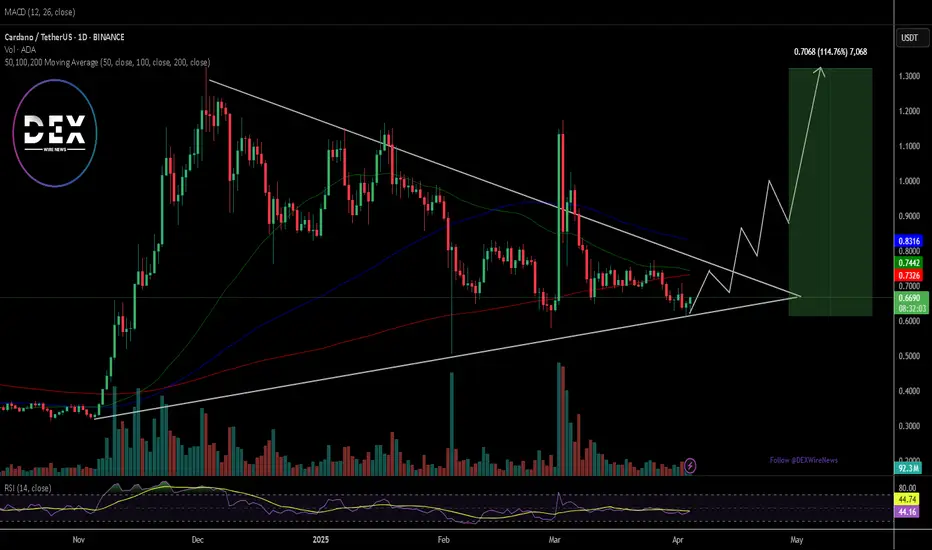
Breaking: $ADA Set for 100% Surge Amidst Launching of VeridianCardano the proof-of-stake blockchain platform that says its goal is to allow “changemakers, innovators and visionaries” to bring about positive global change, is set to breakout of a bullish symmetrical triangle with a 100% surge in sight amidst The Cardano Foundation launching "Veridian", an open-
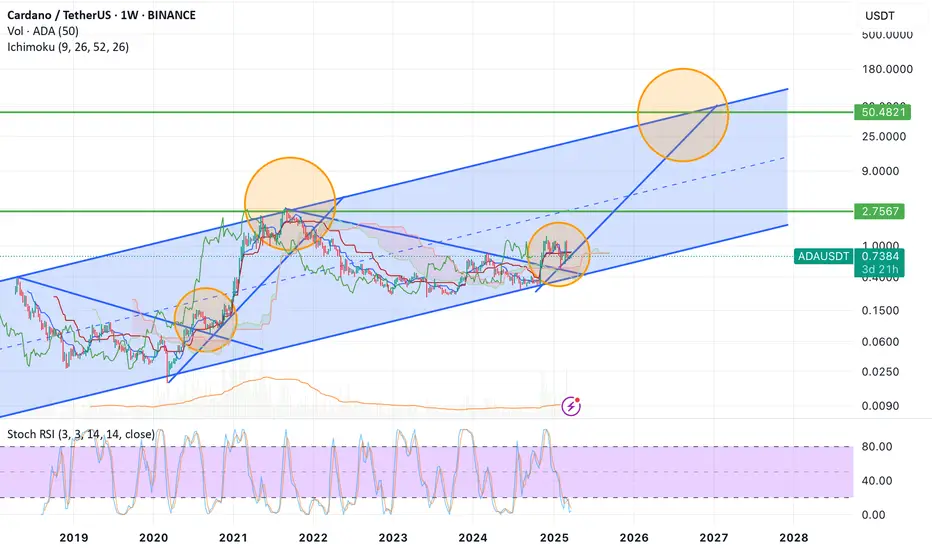
Cardano is completing its third recurring pattern.Each pattern begins with a sharp upward pump, followed by a peak phase (blue), a decline phase (yellow), and finally a recovery phase (purple). Currently, we appear to be at or near the end of this pattern, which opens up the potential for another leg up.
📉 On the weekly StochRSI, we are in the ove

See all ideas
Summarizing what the indicators are suggesting.
Oscillators
Neutral
SellBuy
Strong sellStrong buy
Strong sellSellNeutralBuyStrong buy
Oscillators
Neutral
SellBuy
Strong sellStrong buy
Strong sellSellNeutralBuyStrong buy
Summary
Neutral
SellBuy
Strong sellStrong buy
Strong sellSellNeutralBuyStrong buy
Summary
Neutral
SellBuy
Strong sellStrong buy
Strong sellSellNeutralBuyStrong buy
Summary
Neutral
SellBuy
Strong sellStrong buy
Strong sellSellNeutralBuyStrong buy
Moving Averages
Neutral
SellBuy
Strong sellStrong buy
Strong sellSellNeutralBuyStrong buy
Moving Averages
Neutral
SellBuy
Strong sellStrong buy
Strong sellSellNeutralBuyStrong buy
Displays a symbol's price movements over previous years to identify recurring trends.
Frequently Asked Questions
The current price of Cardano / TetherUS (ADA) is 0.5601 USDT — it has fallen −2.37% in the past 24 hours. Try placing this info into the context by checking out what coins are also gaining and losing at the moment and seeing ADA price chart.
Cardano / TetherUS price has fallen by −6.77% over the last week, its month performance shows a −31.20% decrease, and as for the last year, Cardano / TetherUS has decreased by −4.64%. See more dynamics on ADA price chart.
Keep track of coins' changes with our Crypto Coins Heatmap.
Keep track of coins' changes with our Crypto Coins Heatmap.
Cardano / TetherUS (ADA) reached its highest price on Sep 2, 2021 — it amounted to 3.1010 USDT. Find more insights on the ADA price chart.
See the list of crypto gainers and choose what best fits your strategy.
See the list of crypto gainers and choose what best fits your strategy.
Cardano / TetherUS (ADA) reached the lowest price of 0.0177 USDT on Mar 13, 2020. View more Cardano / TetherUS dynamics on the price chart.
See the list of crypto losers to find unexpected opportunities.
See the list of crypto losers to find unexpected opportunities.
The safest choice when buying ADA is to go to a well-known crypto exchange. Some of the popular names are Binance, Coinbase, Kraken. But you'll have to find a reliable broker and create an account first. You can trade ADA right from TradingView charts — just choose a broker and connect to your account.
Crypto markets are famous for their volatility, so one should study all the available stats before adding crypto assets to their portfolio. Very often it's technical analysis that comes in handy. We prepared technical ratings for Cardano / TetherUS (ADA): today its technical analysis shows the sell signal, and according to the 1 week rating ADA shows the sell signal. And you'd better dig deeper and study 1 month rating too — it's sell. Find inspiration in Cardano / TetherUS trading ideas and keep track of what's moving crypto markets with our crypto news feed.
Cardano / TetherUS (ADA) is just as reliable as any other crypto asset — this corner of the world market is highly volatile. Today, for instance, Cardano / TetherUS is estimated as 6.97% volatile. The only thing it means is that you must prepare and examine all available information before making a decision. And if you're not sure about Cardano / TetherUS, you can find more inspiration in our curated watchlists.
You can discuss Cardano / TetherUS (ADA) with other users in our public chats, Minds or in the comments to Ideas.