Key Features and Explanation
Trade Setup Summary
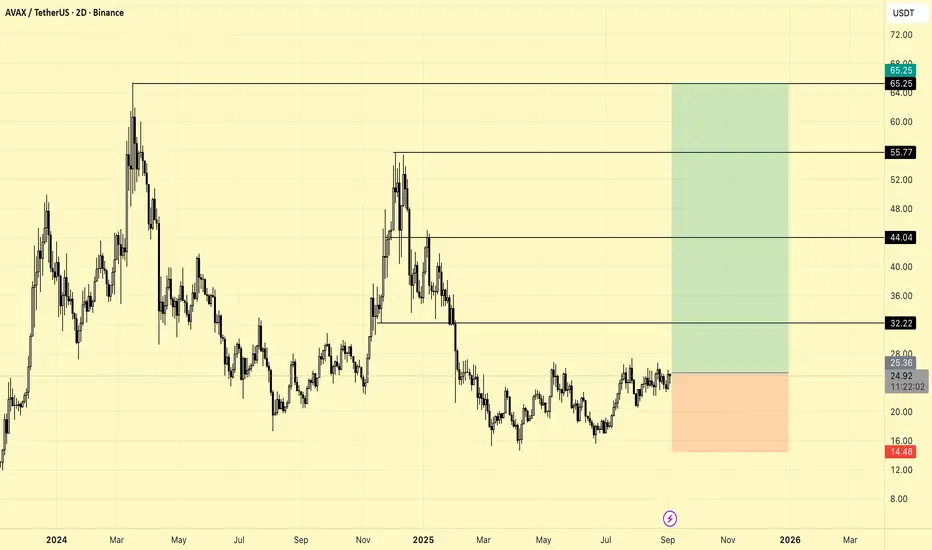
The chart captures a medium-term opportunity favoring a move up from the current range, aiming for the outlined resistance targets with managed stop-loss.
Level markings help define clear entries, exits, and targets for risk management.
Overall, this chart offers a structured technical outlook for AVAXUSDT, combining price levels with visual risk/reward parameters for effective trading assessment.
- Main support zone is marked at 14.48 USDT, indicating the stop-loss level for the setup.
- Major resistance zones are drawn at 32.22, 44.04, 55.77, and 65.25 USDT as potential upside targets.
- The green zone shows the reward/risk area for a bullish scenario, while the red zone visualizes the risk if price drops below support.
- Current price is around 24.95 USDT, in a sideways consolidation near local resistance.
Trade Setup Summary
The chart captures a medium-term opportunity favoring a move up from the current range, aiming for the outlined resistance targets with managed stop-loss.
Level markings help define clear entries, exits, and targets for risk management.
Overall, this chart offers a structured technical outlook for AVAXUSDT, combining price levels with visual risk/reward parameters for effective trading assessment.
Trade active
TP 1 already done.CryptoSignalAPP is the best crypto signal application.
Download to Earn
Get most profitable trading signals and information about market.
Keep your risk management.
Make profit !
cryptosignalapp.app.link
Download to Earn
Get most profitable trading signals and information about market.
Keep your risk management.
Make profit !
cryptosignalapp.app.link
Disclaimer
The information and publications are not meant to be, and do not constitute, financial, investment, trading, or other types of advice or recommendations supplied or endorsed by TradingView. Read more in the Terms of Use.
CryptoSignalAPP is the best crypto signal application.
Download to Earn
Get most profitable trading signals and information about market.
Keep your risk management.
Make profit !
cryptosignalapp.app.link
Download to Earn
Get most profitable trading signals and information about market.
Keep your risk management.
Make profit !
cryptosignalapp.app.link
Disclaimer
The information and publications are not meant to be, and do not constitute, financial, investment, trading, or other types of advice or recommendations supplied or endorsed by TradingView. Read more in the Terms of Use.