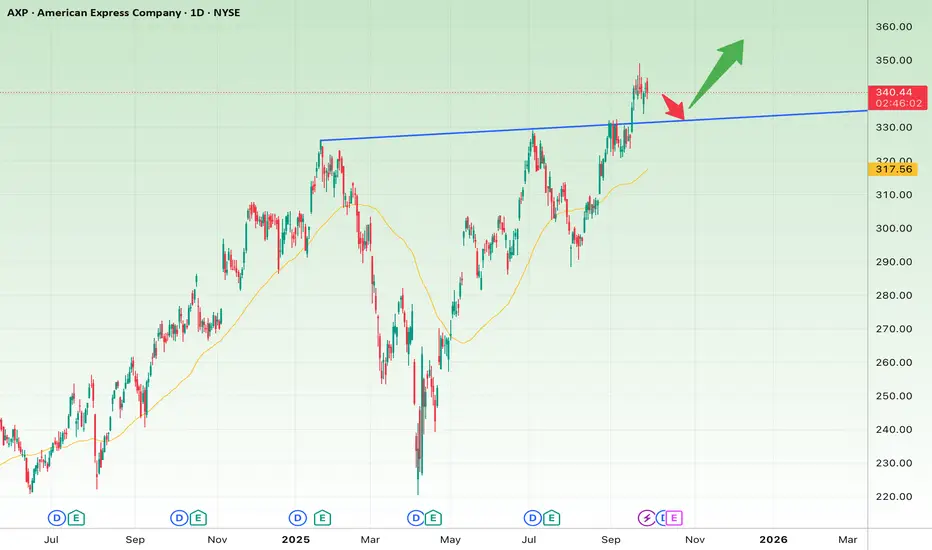
Looking at the daily chart of AXP, here’s a breakdown:
📊 Short-Term Outlook (1–4 weeks)
Price Structure: The stock has broken above its previous all-time high (~$335–337) and is now attempting to hold above it.
Risk: A pullback to the breakout level is possible (red arrow on chart).
Key Support: $335–330 (breakout level + trendline).
Short-Term Stop Loss: Below $330 (on a confirmed daily close).
Short-Term Target: $350–355.
➡️ As long as AXP holds above $335, the short-term trend favors continuation toward $350–355.
📊 Long-Term Outlook (2–6 months)
Primary Trend: Still bullish, with the 50-day moving average acting as dynamic support.
Major Support Zone: $317 (50-day MA + key swing low).
Long-Term Stop Loss: Below $317 on a confirmed close.
Long-Term Targets: If price breaks and sustains above $355, the next levels are $370 and $390.
➡️ The long-term uptrend remains intact unless price falls below $317.
🎯 Summary
Short-Term Trade Idea: Buy above $335, target $350–355, stop loss at $330.
Long-Term Position: Hold above $317 with upside targets at $370 and $390.
Disclaimer
The information and publications are not meant to be, and do not constitute, financial, investment, trading, or other types of advice or recommendations supplied or endorsed by TradingView. Read more in the Terms of Use.
Disclaimer
The information and publications are not meant to be, and do not constitute, financial, investment, trading, or other types of advice or recommendations supplied or endorsed by TradingView. Read more in the Terms of Use.