4-Hour Chart (Macro Trend)
Structure: The Bank Nifty has experienced a sharp correction, breaking below the lower trendline of the aggressive ascending channel. This signals a clear Market Structure Shift (MSS) on the steep short-term momentum. The aggressive bearish candle (Oct 24th) shows strong profit-booking from the ATH. The current price is testing the 57,750 - 58,000 zone, which now acts as overhead resistance.
Key Levels:
Major Supply (Resistance): 58,100 - 58,300. This area (the breakdown level and the FVG on the chart) is the immediate overhead resistance.
Major Demand (Support): 57,100 - 57,300. This area, which includes the lower channel trendline and a strong FVG (Fair Value Gap), is the must-hold zone to prevent a further large correction.
Outlook: The bias is Corrective within an Uptrend. We expect the market to consolidate or retest the 57,100 support before any bullish move.
1-Hour Chart (Intermediate View)
Structure: The 1H chart shows a clear breakdown from the steep ascending channel. The price is now trading within a descending channel, confirming the short-term correction. The close is just above the 57,600 support level.
Key Levels:
Immediate Resistance: 57,900 - 58,000 (Psychological mark and breakdown level).
Immediate Support: 57,500 - 57,600 (Lower channel boundary/FVG zone).
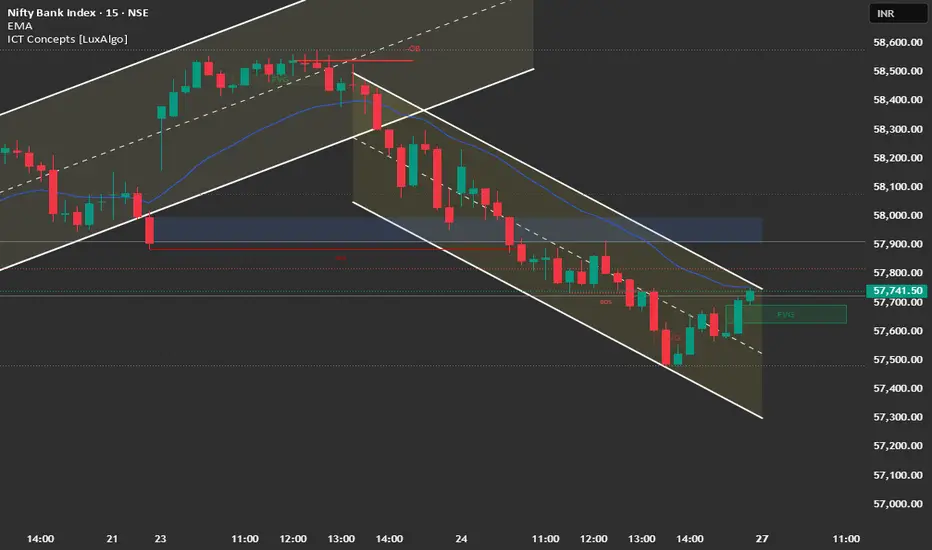
15-Minute Chart (Intraday View)
Structure: The 15M chart confirms the steep descending channel and strong intraday bearish control. The price closed right on the lower boundary of a small FVG area, suggesting a temporary bounce is possible at the open, but the overall bias is to the downside.
Key Levels:
Intraday Supply: 57,900.
Intraday Demand: 57,200.
Outlook: Neutral-to-Bearish for the session open. A "Sell on Rise" strategy is favorable.
📈 Structure Analysis & Trade Plan: 27th October
Market Outlook: Bank Nifty is undergoing a sharp correction after hitting a new ATH. The key battleground is the 57,100 - 57,300 FVG zone.
Bearish Scenario (Primary Plan: Correction Continuation/Sell on Rise)
Justification: The sharp breakdown below the channel and the loss of momentum from the ATH favor a deeper correction toward the major demand zone.
Entry: Short entry on a retest and rejection of the 57,900 - 58,100 zone (breakdown level) OR Short a decisive break and 15-minute candle close below 57,500.
Stop Loss (SL): Place a stop loss above 58,300 (above the last swing high).
Targets:
T1: 57,300 (Major FVG support).
T2: 57,100 (Strong Demand Zone).
T3: 56,800 (Deeper FVG).
Bullish Scenario (Counter-Trend/Reversal)
Justification: Only valid if strong buying emerges to defend the major structural support and reclaim the bullish momentum.
Trigger: A sustained move and close above 58,200.
Entry: Long entry on a confirmed 15-minute close above 58,200.
Stop Loss (SL): Below 57,800.
Targets:
T1: 58,577 (All-Time High retest).
T2: 59,000 (Psychological extension target).
Key Levels for Observation:
Immediate Decision Point: 57,500 - 58,100 zone.
Bearish Confirmation: Sustained trade below 57,500.
Bullish Warning: A move back above 58,100.
Line in the Sand: 57,100. A break below this level shifts the medium-term bias to a deeper corrective phase.
Structure: The Bank Nifty has experienced a sharp correction, breaking below the lower trendline of the aggressive ascending channel. This signals a clear Market Structure Shift (MSS) on the steep short-term momentum. The aggressive bearish candle (Oct 24th) shows strong profit-booking from the ATH. The current price is testing the 57,750 - 58,000 zone, which now acts as overhead resistance.
Key Levels:
Major Supply (Resistance): 58,100 - 58,300. This area (the breakdown level and the FVG on the chart) is the immediate overhead resistance.
Major Demand (Support): 57,100 - 57,300. This area, which includes the lower channel trendline and a strong FVG (Fair Value Gap), is the must-hold zone to prevent a further large correction.
Outlook: The bias is Corrective within an Uptrend. We expect the market to consolidate or retest the 57,100 support before any bullish move.
1-Hour Chart (Intermediate View)
Structure: The 1H chart shows a clear breakdown from the steep ascending channel. The price is now trading within a descending channel, confirming the short-term correction. The close is just above the 57,600 support level.
Key Levels:
Immediate Resistance: 57,900 - 58,000 (Psychological mark and breakdown level).
Immediate Support: 57,500 - 57,600 (Lower channel boundary/FVG zone).
15-Minute Chart (Intraday View)
Structure: The 15M chart confirms the steep descending channel and strong intraday bearish control. The price closed right on the lower boundary of a small FVG area, suggesting a temporary bounce is possible at the open, but the overall bias is to the downside.
Key Levels:
Intraday Supply: 57,900.
Intraday Demand: 57,200.
Outlook: Neutral-to-Bearish for the session open. A "Sell on Rise" strategy is favorable.
📈 Structure Analysis & Trade Plan: 27th October
Market Outlook: Bank Nifty is undergoing a sharp correction after hitting a new ATH. The key battleground is the 57,100 - 57,300 FVG zone.
Bearish Scenario (Primary Plan: Correction Continuation/Sell on Rise)
Justification: The sharp breakdown below the channel and the loss of momentum from the ATH favor a deeper correction toward the major demand zone.
Entry: Short entry on a retest and rejection of the 57,900 - 58,100 zone (breakdown level) OR Short a decisive break and 15-minute candle close below 57,500.
Stop Loss (SL): Place a stop loss above 58,300 (above the last swing high).
Targets:
T1: 57,300 (Major FVG support).
T2: 57,100 (Strong Demand Zone).
T3: 56,800 (Deeper FVG).
Bullish Scenario (Counter-Trend/Reversal)
Justification: Only valid if strong buying emerges to defend the major structural support and reclaim the bullish momentum.
Trigger: A sustained move and close above 58,200.
Entry: Long entry on a confirmed 15-minute close above 58,200.
Stop Loss (SL): Below 57,800.
Targets:
T1: 58,577 (All-Time High retest).
T2: 59,000 (Psychological extension target).
Key Levels for Observation:
Immediate Decision Point: 57,500 - 58,100 zone.
Bearish Confirmation: Sustained trade below 57,500.
Bullish Warning: A move back above 58,100.
Line in the Sand: 57,100. A break below this level shifts the medium-term bias to a deeper corrective phase.
Disclaimer
The information and publications are not meant to be, and do not constitute, financial, investment, trading, or other types of advice or recommendations supplied or endorsed by TradingView. Read more in the Terms of Use.
Disclaimer
The information and publications are not meant to be, and do not constitute, financial, investment, trading, or other types of advice or recommendations supplied or endorsed by TradingView. Read more in the Terms of Use.