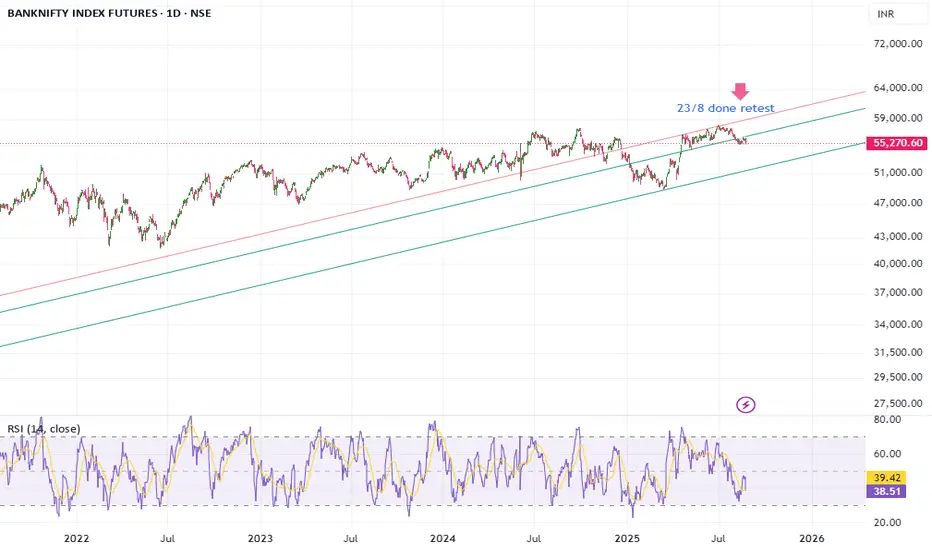
everyone can be intrested in this chart pattern, it DEPAND on indian economy, how does india grow this chart will tell ,
if looking at daily and long time channel , it is worry sign for indian economy, this chart have major spot that is very deep down, and it have alredy done retest of its above channel line, 52000- 52500 can work as spot , looking at chart pattern , and it can have very smll stop loss in it.
That is what this chart is saying right now , i wish if i m wrong
Disclaimer
The information and publications are not meant to be, and do not constitute, financial, investment, trading, or other types of advice or recommendations supplied or endorsed by TradingView. Read more in the Terms of Use.
Disclaimer
The information and publications are not meant to be, and do not constitute, financial, investment, trading, or other types of advice or recommendations supplied or endorsed by TradingView. Read more in the Terms of Use.