### **Symmetrical Triangle Breakout Analysis – Bharti Airtel Ltd (Weekly Chart)**
#### **1️⃣ Pattern Overview**
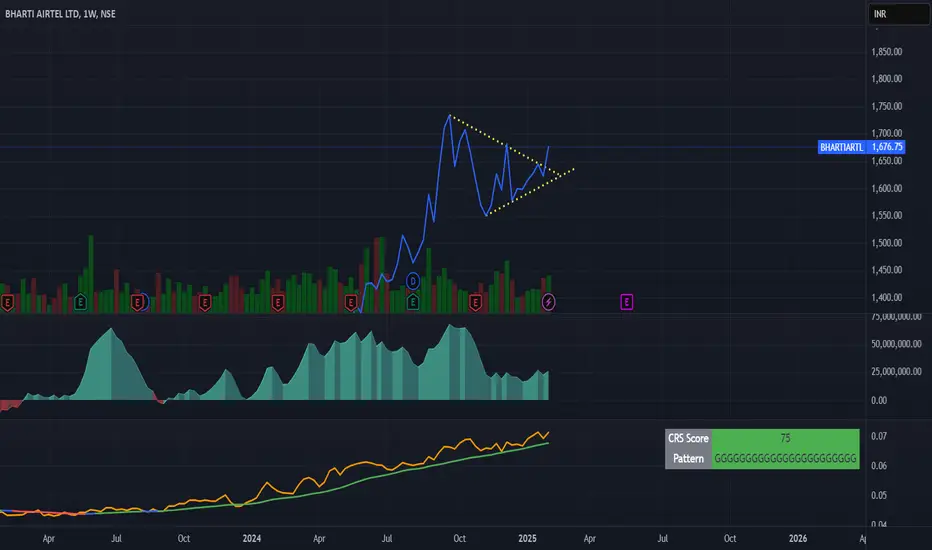
- A **Symmetrical Triangle** has formed after a strong **uptrend**, indicating a potential continuation.
- The price is **compressing within converging trendlines**, suggesting a breakout is near.
#### **2️⃣ Breakout Confirmation**
✅ **Bullish Scenario:**
- A **break and close above ₹1,700** with strong volume confirms an upside breakout.
- The breakout target is the **height of the triangle added to the breakout level** (estimated around **₹1,850 - ₹1,900**).
- RSI and **CRS Score of 75** indicate relative strength in the stock.
❌ **Bearish Scenario:**
- A **break below ₹1,600** with volume suggests a downside move.
- The price may test **₹1,450 - ₹1,400** if the breakdown is confirmed.
#### **3️⃣ Key Indicators to Watch**
📊 **Volume:** A spike in volume will confirm a strong breakout.
📉 **RSI & Momentum:** If RSI stays above 50, the bullish momentum remains intact.
🟢 **CRS Score (75):** Indicates stock is outperforming the market.
#### **4️⃣ Trade Plan**
📌 **Entry:** Buy above ₹1,700 after breakout confirmation.
📌 **Stop Loss:** Below ₹1,600 (previous support).
📌 **Target:** ₹1,850 - ₹1,900 for a bullish breakout.
🚀 **Final View:** **Stock is in a strong uptrend, and a breakout above ₹1,700 could trigger a big move. Keep an eye on volume and confirmation candle!**
#### **1️⃣ Pattern Overview**
- A **Symmetrical Triangle** has formed after a strong **uptrend**, indicating a potential continuation.
- The price is **compressing within converging trendlines**, suggesting a breakout is near.
#### **2️⃣ Breakout Confirmation**
✅ **Bullish Scenario:**
- A **break and close above ₹1,700** with strong volume confirms an upside breakout.
- The breakout target is the **height of the triangle added to the breakout level** (estimated around **₹1,850 - ₹1,900**).
- RSI and **CRS Score of 75** indicate relative strength in the stock.
❌ **Bearish Scenario:**
- A **break below ₹1,600** with volume suggests a downside move.
- The price may test **₹1,450 - ₹1,400** if the breakdown is confirmed.
#### **3️⃣ Key Indicators to Watch**
📊 **Volume:** A spike in volume will confirm a strong breakout.
📉 **RSI & Momentum:** If RSI stays above 50, the bullish momentum remains intact.
🟢 **CRS Score (75):** Indicates stock is outperforming the market.
#### **4️⃣ Trade Plan**
📌 **Entry:** Buy above ₹1,700 after breakout confirmation.
📌 **Stop Loss:** Below ₹1,600 (previous support).
📌 **Target:** ₹1,850 - ₹1,900 for a bullish breakout.
🚀 **Final View:** **Stock is in a strong uptrend, and a breakout above ₹1,700 could trigger a big move. Keep an eye on volume and confirmation candle!**
Disclaimer
The information and publications are not meant to be, and do not constitute, financial, investment, trading, or other types of advice or recommendations supplied or endorsed by TradingView. Read more in the Terms of Use.
Disclaimer
The information and publications are not meant to be, and do not constitute, financial, investment, trading, or other types of advice or recommendations supplied or endorsed by TradingView. Read more in the Terms of Use.