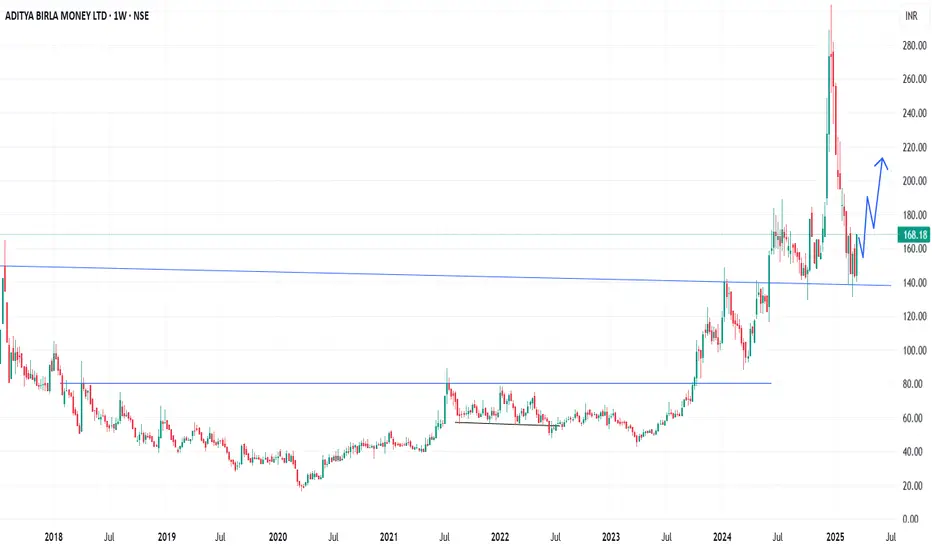
In the Weekly Chart of BIRLAMONEY ,
we can see that; it has given a strong bounce back from Support Trendline.
Let it create one or two halt candle and then up move might continue.
Expected momentum is shown in chart.
we can see that; it has given a strong bounce back from Support Trendline.
Let it create one or two halt candle and then up move might continue.
Expected momentum is shown in chart.
Disclaimer
The information and publications are not meant to be, and do not constitute, financial, investment, trading, or other types of advice or recommendations supplied or endorsed by TradingView. Read more in the Terms of Use.
Disclaimer
The information and publications are not meant to be, and do not constitute, financial, investment, trading, or other types of advice or recommendations supplied or endorsed by TradingView. Read more in the Terms of Use.