THE KOG REPORT - UpdateEnd of day update from us here at KOG:
A nice end to the week with gold giving us the long into the level we wanted and then the red box reaction giving the short trade. We're now approaching the key level support and order region 2650-55 which is where we would expect a potential RIP.
For now, we're done for another successful week on the markets, red boxes playing out perfectly, the KOG Report near enough with a little modification to the plan.
Wishing you all a great weekend ahead and we'll be back on Sunday with the KOG Report and our view for the week ahead.
As always, trade safe.
KOG
Supply and Demand

Key levels for BTCUSDTKey levels and trand lines for BTCUSDT
this is idea for road map and possible move for price on levels

How to Identify Significant Liquidity Zone in Gold Trading
A liquidity zone is a specific area on a price chart where the market orders concentrate.
In this article, I will teach you how to identify the most significant liquidity zones on Gold chart beyond historical levels.
Liquidity Zones
First, in brief, let's discuss where liquidity concentrates.
Market liquidity concentrates on:
1. Psychological levels
Above, you can see a clear concentration of liquidity around a 2500 psychological level on Gold price chart.
2. Fibonacci levels
In the example above, we can see how 382 retracement of a major bullish impulse attracts market liquidity on Gold XAUUSD daily time frame.
3. Horizontal support and resistance levels and trend lines.
In that case, an area based on a classic support/resistance level was a clear source of market liquidity on Gold.
Significant Liquidity Zone
A significant liquidity zone will be the area where psychological levels, Fibonacci levels, horizontal support and resistance levels and trend lines match .
Please, note that such an area may combine the indicators, or any other technical tools.
Such zones can be easily found even beyond the historic levels.
Look at a price chart on Gold on a daily.
Though the market has just updated the ATH, we can spot the next potentially significant liquidity zone with technical analysis.
We see a perfect intersection of a rising trend line, 2600 psychological level based on round numbers and a Fibonacci extension confluence of 2 recent bullish impulses.
These technical tools will compose a significant liquidity zone.
The idea is that Gold was rallying up because of the excess of demand on the market. We will assume that selling orders will be placed within that liquidity zone and the excess of demand will be absorbed by the supply.
It will make the price AT LEAST stop growing and potentially will trigger a correctional movement.
Learn to recognize such liquidity zones, it will help you a lot in predicting Gold price movements.
❤️Please, support my work with like, thank you!❤️

TSLA Flash back to 2021 TopIf you've been following me for a while, I don't really do things like this and just keep focused on stock setups to lead my next best action.
The narrow market in the last couple weeks got me digging and NASDAQ:TSLA run reminding me of 2021 top.
So went a bit deeper and price action is almost identical before that top.
Again, I have no clue what will happen next but what I know for damn certain is that I want to see money start flowing back into the rest of the market before I get aggressive again.
AMEX:IWM AMEX:SPY CSE:QQ

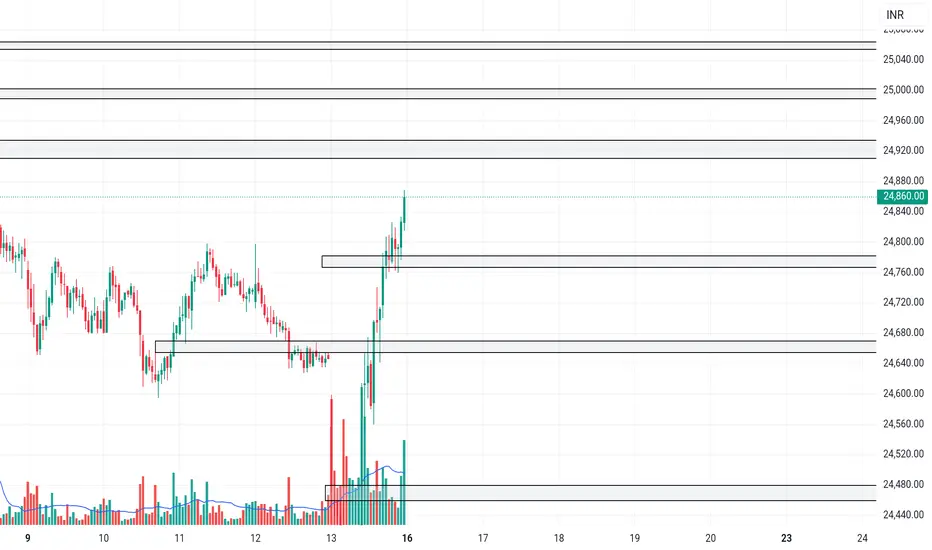
NIFTYNifty levels are based on imbalances
1. gapup 24950 long
2. 25950-24750 trade breakout
3. gapdown 24750 short
Key levels for ETHUSDTKey levels for ETHUSDT
trend lines and road map for ETH
ETH is leader Alts and if go up for 5000 then Alts More pump

AUDCHF: Textbook Bullish BreakoutAUDCHF has ended its consolidation phase by breaking above a resistance level within a broad horizontal range on the 4-hour chart.
This breakout suggests potential for further upside, with a target of at least 0.5721.

RSRUSDT: Prime Demand Zone on Lower Time FrameThe blue box marks the strongest demand zone on the lower time frame for RSRUSDT. This level is ideal for potential buy entries, as it represents an area where buyers are likely to step in aggressively.
Watch for price reactions within this zone and consider lower time frame confirmations for optimal entries. Always manage risk effectively.
I keep my charts clean and simple because I believe clarity leads to better decisions.
My approach is built on years of experience and a solid track record. I don’t claim to know it all, but I’m confident in my ability to spot high-probability setups.
My Previous Analysis
🐶 DOGEUSDT.P: Next Move
🎨 RENDERUSDT.P: Opportunity of the Month
💎 ETHUSDT.P: Where to Retrace
🟢 BNBUSDT.P: Potential Surge
📊 BTC Dominance: Reaction Zone
🌊 WAVESUSDT.P: Demand Zone Potential
🟣 UNIUSDT.P: Long-Term Trade
🔵 XRPUSDT.P: Entry Zones
🔗 LINKUSDT.P: Follow The River
📈 BTCUSDT.P: Two Key Demand Zones
🟩 POLUSDT: Bullish Momentum
🌟 PENDLEUSDT: Where Opportunity Meets Precision
🔥 BTCUSDT.P: Liquidation of Highly Leveraged Longs
🌊 SOLUSDT.P: SOL's Dip - Your Opportunity
🐸 1000PEPEUSDT.P: Prime Bounce Zone Unlocked
🚀 ETHUSDT.P: Set to Explode - Don't Miss This Game Changer
🤖 IQUSDT: Smart Plan
⚡️ PONDUSDT: A Trade Not Taken Is Better Than a Losing One
💼 STMXUSDT: 2 Buying Areas
🐢 TURBOUSDT: Buy Zones and Buyer Presence

DOW JONES - BEARISH MOVEHello Traders !
The Dow Jones price failed to create a new higher high !
Currently, The Higher low is broken (change of character).
So, I expect a bearish move📉
_______________
TARGET: 43315.00🎯

JUVUSDT: High Volume Growth Huge OpportunityJUVUSDT ranks as the 3rd highest volume gainer this week, with a 177% increase in volume. While the price has been hovering near its lowest levels, demand points have been kept moderately higher to reflect potential movement.
The price doesn’t appear expensive, but due to its susceptibility to manipulation, risk management is crucial. Monitor price action closely and avoid overexposure, focusing on controlled entries and exits.
I keep my charts clean and simple because I believe clarity leads to better decisions.
My approach is built on years of experience and a solid track record. I don’t claim to know it all, but I’m confident in my ability to spot high-probability setups.
My Previous Analysis
🐶 DOGEUSDT.P: Next Move
🎨 RENDERUSDT.P: Opportunity of the Month
💎 ETHUSDT.P: Where to Retrace
🟢 BNBUSDT.P: Potential Surge
📊 BTC Dominance: Reaction Zone
🌊 WAVESUSDT.P: Demand Zone Potential
🟣 UNIUSDT.P: Long-Term Trade
🔵 XRPUSDT.P: Entry Zones
🔗 LINKUSDT.P: Follow The River
📈 BTCUSDT.P: Two Key Demand Zones
🟩 POLUSDT: Bullish Momentum
🌟 PENDLEUSDT: Where Opportunity Meets Precision
🔥 BTCUSDT.P: Liquidation of Highly Leveraged Longs
🌊 SOLUSDT.P: SOL's Dip - Your Opportunity
🐸 1000PEPEUSDT.P: Prime Bounce Zone Unlocked
🚀 ETHUSDT.P: Set to Explode - Don't Miss This Game Changer
🤖 IQUSDT: Smart Plan
⚡️ PONDUSDT: A Trade Not Taken Is Better Than a Losing One
💼 STMXUSDT: 2 Buying Areas
🐢 TURBOUSDT: Buy Zones and Buyer Presence

FLOKIUSDT: %81 Volume Spike, Be Careful!
FLOKIUSDT is seeing a 81% increase in daily volume, signaling heightened interest and making it an ideal asset for trading opportunities.
The blue boxes highlight the best demand zones on the daily time frame for FLOKIUSDT. These areas are likely to attract significant buying interest, making them ideal for potential entries.
Look for confirmation through price reactions or market structure breaks within these zones for optimal trade setups. Manage risk carefully.
I keep my charts clean and simple because I believe clarity leads to better decisions.
My approach is built on years of experience and a solid track record. I don’t claim to know it all, but I’m confident in my ability to spot high-probability setups.
My Previous Analysis
🐶 DOGEUSDT.P: Next Move
🎨 RENDERUSDT.P: Opportunity of the Month
💎 ETHUSDT.P: Where to Retrace
🟢 BNBUSDT.P: Potential Surge
📊 BTC Dominance: Reaction Zone
🌊 WAVESUSDT.P: Demand Zone Potential
🟣 UNIUSDT.P: Long-Term Trade
🔵 XRPUSDT.P: Entry Zones
🔗 LINKUSDT.P: Follow The River
📈 BTCUSDT.P: Two Key Demand Zones
🟩 POLUSDT: Bullish Momentum
🌟 PENDLEUSDT: Where Opportunity Meets Precision
🔥 BTCUSDT.P: Liquidation of Highly Leveraged Longs
🌊 SOLUSDT.P: SOL's Dip - Your Opportunity
🐸 1000PEPEUSDT.P: Prime Bounce Zone Unlocked
🚀 ETHUSDT.P: Set to Explode - Don't Miss This Game Changer
🤖 IQUSDT: Smart Plan
⚡️ PONDUSDT: A Trade Not Taken Is Better Than a Losing One
💼 STMXUSDT: 2 Buying Areas
🐢 TURBOUSDT: Buy Zones and Buyer Presence

RDNT has a large bullish pattern!Before anything, it should be noted that an important trendline has been broken and the price has cleared a key range.
Upon further inspection, it seems there is a large QM pattern on the chart, and we can consider buying within the support zone of this QM.
Targets are marked on the chart.
The closure of a daily candle below the invalidation level will invalidate this analysis.
For risk management, please don't forget stop loss and capital management
When we reach the first target, save some profit and then change the stop to entry
Comment if you have any questions
Thank You

High-Potential Demand Zone with Explosive Volume GrowthWANUSDT is showing exceptional potential as one of the top 5 coins on Binance with the highest volume growth, boasting a 150% weekly volume increase. The highlighted demand point is a critical level that could offer very high profit opportunities if the price retraces into this zone.
Monitor this level closely for entries and confirm with price reactions or lower time frame signals. Always proceed with prudent risk management.
I keep my charts clean and simple because I believe clarity leads to better decisions.
My approach is built on years of experience and a solid track record. I don’t claim to know it all, but I’m confident in my ability to spot high-probability setups.
My Previous Analysis
🐶 DOGEUSDT.P: Next Move
🎨 RENDERUSDT.P: Opportunity of the Month
💎 ETHUSDT.P: Where to Retrace
🟢 BNBUSDT.P: Potential Surge
📊 BTC Dominance: Reaction Zone
🌊 WAVESUSDT.P: Demand Zone Potential
🟣 UNIUSDT.P: Long-Term Trade
🔵 XRPUSDT.P: Entry Zones
🔗 LINKUSDT.P: Follow The River
📈 BTCUSDT.P: Two Key Demand Zones
🟩 POLUSDT: Bullish Momentum
🌟 PENDLEUSDT: Where Opportunity Meets Precision
🔥 BTCUSDT.P: Liquidation of Highly Leveraged Longs
🌊 SOLUSDT.P: SOL's Dip - Your Opportunity
🐸 1000PEPEUSDT.P: Prime Bounce Zone Unlocked
🚀 ETHUSDT.P: Set to Explode - Don't Miss This Game Changer
🤖 IQUSDT: Smart Plan
⚡️ PONDUSDT: A Trade Not Taken Is Better Than a Losing One
💼 STMXUSDT: 2 Buying Areas
🐢 TURBOUSDT: Buy Zones and Buyer Presence

REQUSDT: Explosive Volume Increase with Little Buyer ActivityREQUSDT is experiencing a 683% surge in volume, signaling that buyers are just stepping in. This incredible volume increase suggests strong potential for significant upward moves if captured from a key level.
It’s beneficial to proceed with low risk, focusing on well-defined demand zones or confirmations on lower time frames. Proper positioning here can yield great results. Always prioritize risk management.
I keep my charts clean and simple because I believe clarity leads to better decisions.
My approach is built on years of experience and a solid track record. I don’t claim to know it all, but I’m confident in my ability to spot high-probability setups.
My Previous Analysis
🐶 DOGEUSDT.P: Next Move
🎨 RENDERUSDT.P: Opportunity of the Month
💎 ETHUSDT.P: Where to Retrace
🟢 BNBUSDT.P: Potential Surge
📊 BTC Dominance: Reaction Zone
🌊 WAVESUSDT.P: Demand Zone Potential
🟣 UNIUSDT.P: Long-Term Trade
🔵 XRPUSDT.P: Entry Zones
🔗 LINKUSDT.P: Follow The River
📈 BTCUSDT.P: Two Key Demand Zones
🟩 POLUSDT: Bullish Momentum
🌟 PENDLEUSDT: Where Opportunity Meets Precision
🔥 BTCUSDT.P: Liquidation of Highly Leveraged Longs
🌊 SOLUSDT.P: SOL's Dip - Your Opportunity
🐸 1000PEPEUSDT.P: Prime Bounce Zone Unlocked
🚀 ETHUSDT.P: Set to Explode - Don't Miss This Game Changer
🤖 IQUSDT: Smart Plan
⚡️ PONDUSDT: A Trade Not Taken Is Better Than a Losing One
💼 STMXUSDT: 2 Buying Areas
🐢 TURBOUSDT: Buy Zones and Buyer Presence

%570 Daily Volume Increase, Huge Opportunity
MDTUSDT is showing a 570% increase in daily volume, indicating a surge in trading activity and presenting a huge opportunity. The blue boxes highlight the best demand zones, where strong buying interest is expected.
Monitor these zones for price reactions or lower time frame market structure breaks to confirm entries. Always trade with proper risk management.
I keep my charts clean and simple because I believe clarity leads to better decisions.
My approach is built on years of experience and a solid track record. I don’t claim to know it all, but I’m confident in my ability to spot high-probability setups.
My Previous Analysis
🐶 DOGEUSDT.P: Next Move
🎨 RENDERUSDT.P: Opportunity of the Month
💎 ETHUSDT.P: Where to Retrace
🟢 BNBUSDT.P: Potential Surge
📊 BTC Dominance: Reaction Zone
🌊 WAVESUSDT.P: Demand Zone Potential
🟣 UNIUSDT.P: Long-Term Trade
🔵 XRPUSDT.P: Entry Zones
🔗 LINKUSDT.P: Follow The River
📈 BTCUSDT.P: Two Key Demand Zones
🟩 POLUSDT: Bullish Momentum
🌟 PENDLEUSDT: Where Opportunity Meets Precision
🔥 BTCUSDT.P: Liquidation of Highly Leveraged Longs
🌊 SOLUSDT.P: SOL's Dip - Your Opportunity
🐸 1000PEPEUSDT.P: Prime Bounce Zone Unlocked
🚀 ETHUSDT.P: Set to Explode - Don't Miss This Game Changer
🤖 IQUSDT: Smart Plan
⚡️ PONDUSDT: A Trade Not Taken Is Better Than a Losing One
💼 STMXUSDT: 2 Buying Areas
🐢 TURBOUSDT: Buy Zones and Buyer Presence

Fresh Demand Zone IdentifiedDespite potential year-end challenges in the crypto market, it’s crucial to plan for buying scenarios to navigate adverse conditions. For SHIBUSDT, the fresh demand zone highlighted on the chart represents the strongest remaining support level, where buyers are likely to step in.
This zone offers a strategic entry point for long positions. Monitor closely for price reactions and confirm trades with lower time frame signals. Always manage risk effectively in uncertain market conditions.
I keep my charts clean and simple because I believe clarity leads to better decisions.
My approach is built on years of experience and a solid track record. I don’t claim to know it all, but I’m confident in my ability to spot high-probability setups.
My Previous Analysis
🐶 DOGEUSDT.P: Next Move
🎨 RENDERUSDT.P: Opportunity of the Month
💎 ETHUSDT.P: Where to Retrace
🟢 BNBUSDT.P: Potential Surge
📊 BTC Dominance: Reaction Zone
🌊 WAVESUSDT.P: Demand Zone Potential
🟣 UNIUSDT.P: Long-Term Trade
🔵 XRPUSDT.P: Entry Zones
🔗 LINKUSDT.P: Follow The River
📈 BTCUSDT.P: Two Key Demand Zones
🟩 POLUSDT: Bullish Momentum
🌟 PENDLEUSDT: Where Opportunity Meets Precision
🔥 BTCUSDT.P: Liquidation of Highly Leveraged Longs
🌊 SOLUSDT.P: SOL's Dip - Your Opportunity
🐸 1000PEPEUSDT.P: Prime Bounce Zone Unlocked
🚀 ETHUSDT.P: Set to Explode - Don't Miss This Game Changer
🤖 IQUSDT: Smart Plan
⚡️ PONDUSDT: A Trade Not Taken Is Better Than a Losing One
💼 STMXUSDT: 2 Buying Areas
🐢 TURBOUSDT: Buy Zones and Buyer Presence

Buy Setup for Spot FILUSDTBuy Setup for Spot FILUSDT
good zone
support levels
Break AND pullback on trend line 3D

Solana- Towards 300 into year's end?Solana has been one of the standout performers this year(from large market caps), with its price steadily climbing around 300%.
In March, Solana’s market cap hit a new all-time high, following a price ATH in November. After this achievement, the price experienced a healthy 20% correction, pausing in an old resistance zone that has now turned into support.
Currently, the price has formed a bullish flag, signaling potential upside momentum. A breakout above the flag’s resistance could lead to another leg higher. As long as the $200 support zone holds, a move toward the next major level at $300 appears likely. Buying dips is the preferred strategy.

Where should we buy DRIFT?It seems that from SW H onwards, DRIFT has entered a correction phase.
It could move downward from the red zone (for wave C). Along with the price correction, there will also be a time correction.
There is a fresh demand zone, where short-term buy/long positions can be considered.
The closure of a daily candle below the invalidation level will invalidate this analysis.
For risk management, please don't forget stop loss and capital management
When we reach the first target, save some profit and then change the stop to entry
Comment if you have any questions
Thank You

THE KOG REPORT - UpdateEnd of day update from us here at KOG:
Lovely! We picked that high well on gold with price attempting it, giving the tap and bounce and giving a nice short to end the day back down into the bias level 2680. We now have support here on the 4H which if held, should give traders and opportunity to get a long into the resistance levels of 2685, 2690-5 which is now a key level.
Quick one today, we'll be back again tomorrow to close of the week.
As always, trade safe.
KOG

Bitcoin bearish divergence - Don't fall in influencers' trap BTC had really good rally so far and looks cooling down and printing bearish RSI divergence in 1D chart.
I feel early next week it may retest ATH (even break above for a brief) grab liquidity and RSI will create lower high. It will trap liquidity and start downward trend and chances of having deep pull back to 73k and consolidate. BTC dominance might reach around 59%. This all happens before Trump's inauguration.
FOMC meeting coming next week, expect some volatility.
Be cautious for next few days.
This will invalidate if we have weekly close above ATH with good volume.

Euro-dollar on the brink of collapseGreetings to you all, dear Devan.
I hope you support this analysis as always.
The Euro-Dollar is falling in higher time frames like months and weeks, so we expect a further fall.🔥
We are expected to correct upwards in the new trading week and begin the main fall!🩸
Be sure to keep in mind that this post is analytical and only enter the market in specific areas with your own confirmation and trading setup.✔
Good luck and stay tuned💎💲

HINDUSTAN UNILEVERSWING / POSITIONAL TRADE
HINDUSTAN UNILEVER
CMP - 2390
SL - 2290
TARGET 1 - 1:3 Risk Reward
TARGET 2 - ATH (3000)
Disclaimer: Not Financial Advice. Only for Educational Purposes
Invest at your own risk
