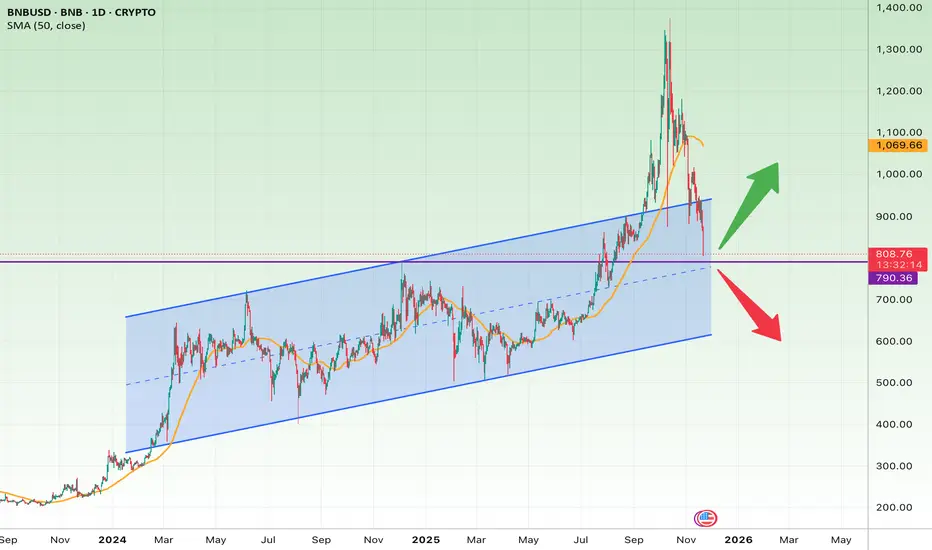
BNB has pulled back sharply from its parabolic run above $1,300, and price is now sitting exactly on the bottom boundary of the rising channel that has guided the trend since late 2023.
This area is extremely important because:
• It is the channel support
• It aligns with a previous consolidation zone
• It’s very close to the 50-day SMA retest zone (which BNB often respects)
If this support holds, BNB could stage a recovery rally. But if it breaks down, the chart opens the door to a much deeper correction.
Bullish Scenario (If channel support holds)
Entry Zone: $780–$820
(BNB is currently inside this zone)
Target 1: $987
– This is the next major resistance and midpoint of the previous structure.
Target 2: $1,070–$1,100
– Retest of the recent breakdown area and 50-day SMA region.
Target 3 (extended): $1,250+
– Only if momentum continues and BTC supports the market.
Bearish Scenario (If price loses the channel)
A breakdown from the channel plus a daily close below $790 would confirm weakness.
Downside Targets:
• $700 — First Fibonacci + structural support
• $620 — Major support zone from 2024
• $500–$520 — Full channel breakdown target
Stop-Loss Suggestion
• Stop-loss (swing trade): $760
– A daily close below this level means the channel is broken.
• Tighter stop-loss (short-term): $780
Summary
BNB is sitting on a critical support level.
Hold → strong bounce potential.
Break → deep correction likely.
Disclaimer
The information and publications are not meant to be, and do not constitute, financial, investment, trading, or other types of advice or recommendations supplied or endorsed by TradingView. Read more in the Terms of Use.
Disclaimer
The information and publications are not meant to be, and do not constitute, financial, investment, trading, or other types of advice or recommendations supplied or endorsed by TradingView. Read more in the Terms of Use.
