Bitcoin line and time
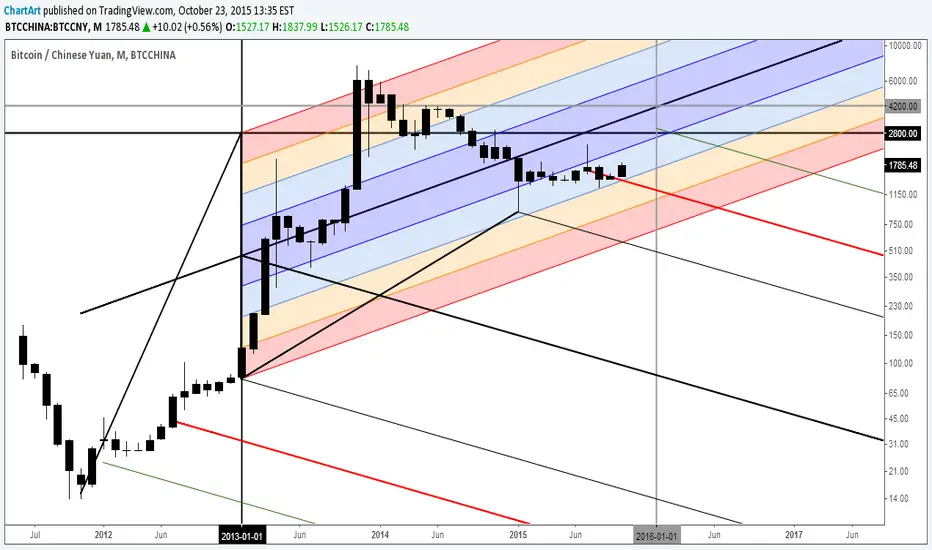
I discovered some interesting relationships that can be drawn as lines onto the Bitcoin monthly chart. It appears there is a older larger uptrend channel, in which the price is still in (blue channel).
Here is a zoomed-in screenshot of this chart:

P.S. An older bullish chart I made 3 months ago:

Here is a zoomed-in screenshot of this chart:
P.S. An older bullish chart I made 3 months ago:
Disclaimer
The information and publications are not meant to be, and do not constitute, financial, investment, trading, or other types of advice or recommendations supplied or endorsed by TradingView. Read more in the Terms of Use.
Disclaimer
The information and publications are not meant to be, and do not constitute, financial, investment, trading, or other types of advice or recommendations supplied or endorsed by TradingView. Read more in the Terms of Use.