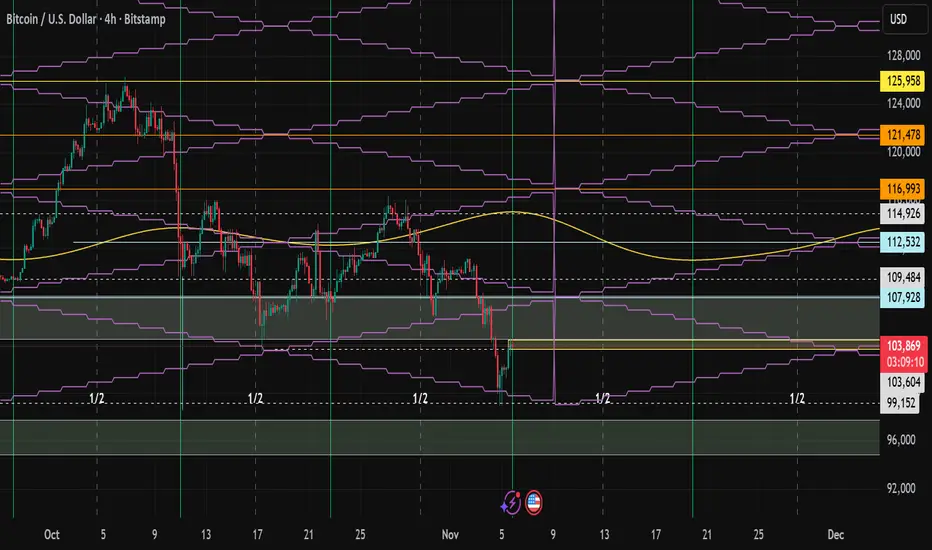
This chart shows one of the latest updates to Time Trades indicators. Essentially, they are astrological, but can also be used by people who do not have in-depth astrological knowledge. Their creator, provides ongoing training on how to work with his indicators.
For this chart, the following were used: Outer Current Wheel of 24 and Vibration Sandbox. The green lines mark periods in which a local time pivot is formed.
The purple diamond is based on the most influential planets in the BTC horoscope (I choose only this. There are many other options).
So, the trader can mark the pivot during the green line time zone and and watch for a retest above this zone or a rejection below it within the time frame between the two green vertical lines. There is often a reversal in the middle of the period, but not always. My choice is to use this interval.
As can be seen, specific rebound or rejection zones also fit almost perfectly into BTC's "birth" diamond.
The rebound after yesterday's long downward movement received unequivocal support and a reversal to long right at the bottom of the diamond.
Now, half of the zone and the upper zone are being monitored.
And the pivot now outlines the 104,000 - 104,500 zone as the current key level.
No hurry, the retest must be awaited.
Disclaimer
The information and publications are not meant to be, and do not constitute, financial, investment, trading, or other types of advice or recommendations supplied or endorsed by TradingView. Read more in the Terms of Use.
Disclaimer
The information and publications are not meant to be, and do not constitute, financial, investment, trading, or other types of advice or recommendations supplied or endorsed by TradingView. Read more in the Terms of Use.