Bitcoin: The Cycle Is Approaching Its Breakout Phase – “Time Is Tightening, the Band Is Compressing”
LETS START =)
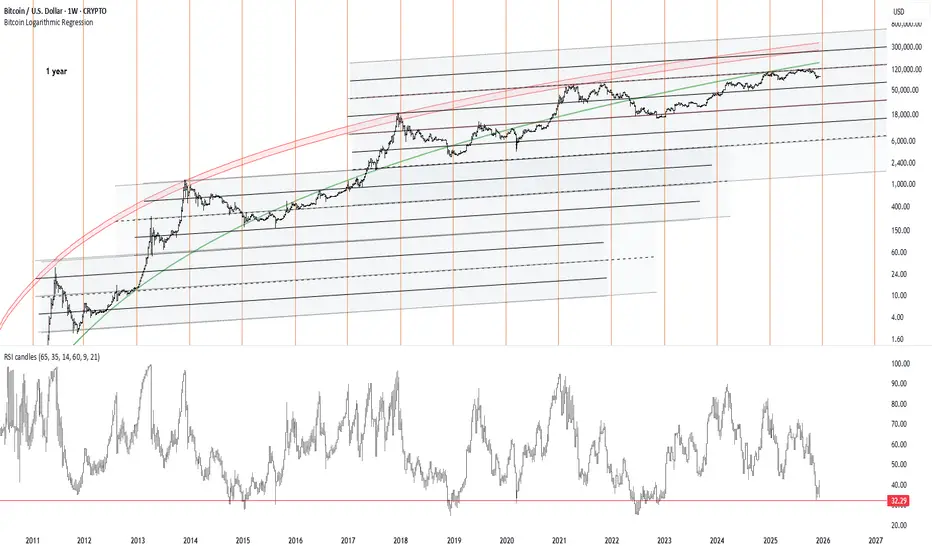
This chart ultimately tells one story:
Bitcoin has never abandoned its 4-year rhythm; it simply reduces volatility each cycle while grinding toward the upper logarithmic band.
Let’s decode the structure step by step.
1) Logarithmic Regression Bands: “Not a trendline, a structural corridor”
The grey–black bands represent a logarithmic channel that Bitcoin has never broken below since 2011.
There are three key layers:
A) Lower-Mid Band (Cycle Floor Support)
→ The bottoms of 2012, 2015, and 2019 all touched this region.
→ Today this zone sits around ~43k–55k.
The fact that the 2022 bottom formed here already confirms that the structural low of this cycle is behind us.
B) Upper-Mid Band (Pre-Top Compression Zone)
→ In every major cycle—2013, 2017, 2021—price consolidated beneath this band right before the final blow-off phase.
→ In 2025, BTC is again compressing inside the same zone.
This implies:
Bitcoin always “stalls” once before the true cycle top.
This stall is happening now.
C) Upper Red Band (Macro Top Territory)
→ All mega tops in 2013, 2017, and 2021 hit this exact red logarithmic curve.
→ The projection for the 2025–2026 cycle peaks lands here again:
185k – 260k.
The red curve marks the end of the road.
2) Cyclical Time Markers (Orange Vertical Lines): “The 1-Year rhythm repeats”
The orange verticals represent Bitcoin’s 1-year hybrid time geometry.
Every yearly block follows the same pattern:
Momentum compresses
Volatility dries up
RSI drifts toward the floor
Final trend expansion happens in the last 3–4 months
Right now, as we enter late 2025:
The time marker again aligns with a cyclical weakness window
Which historically precedes major upside expansions
This mirrors 2012, 2015, 2019, and 2023 perfectly.
The chart is saying:
“Your time window is closing. This is the reset before expansion.”
3) RSI at 32: “Cycle-bottom signal”
The horizontal red line tracks historical cycle-bottom RSI values.
An RSI in the 32–35 range marked:
2011 bottom
2015 bottom
2019 bottom
2023 bottom
In late 2025, RSI is back in the same zone.
This tells us:
The trend is not breaking; momentum is resetting.
This is the last cooldown before the expansion leg.
Bitcoin has never topped a macro cycle with weekly RSI this low.
Every blow-off top occurred with RSI between 70–90.
RSI is saying clearly:
“The cycle top is not in. This bull market is not finished.”
4) Price Behavior: “Compression beneath upper band = calm before ignition”
Bitcoin is currently:
Squeezed between the upper-mid grey band
And the upper red logarithmic curve
Forming the tightest consolidation since 2021
This structure resembles:
→ Mid-2016 (right before the 2017 parabolic run)
→ Summer 2020 (right before the 2021 surge)
Once again, BTC is behaving like a coiled spring—fully compressed, waiting for release.
5) Cyclical Projection (Cryptollica style):
Assuming historical structure repeats:
Short Term (1–3 months):
RSI bottom → sideways grind → momentum reversal
Medium Term (3–9 months):
Break above upper-mid band
→ explosive flow into 85k–110k range
→ sentiment flips fully bullish
Macro Top Window (first half of 2026):
Touch of the upper red band
→ 185k–260k macro top potential
This band has never failed across 3 full cycles.
----------------------------------------------------------------
This chart is not showing weakness.
It is showing a textbook cyclical reset.
**“The 2026 blow-off top hasn’t even started.
This is the final compression…
the final breath…
------------------------------
2013-2018

2021-2026

LETS START =)
This chart ultimately tells one story:
Bitcoin has never abandoned its 4-year rhythm; it simply reduces volatility each cycle while grinding toward the upper logarithmic band.
Let’s decode the structure step by step.
1) Logarithmic Regression Bands: “Not a trendline, a structural corridor”
The grey–black bands represent a logarithmic channel that Bitcoin has never broken below since 2011.
There are three key layers:
A) Lower-Mid Band (Cycle Floor Support)
→ The bottoms of 2012, 2015, and 2019 all touched this region.
→ Today this zone sits around ~43k–55k.
The fact that the 2022 bottom formed here already confirms that the structural low of this cycle is behind us.
B) Upper-Mid Band (Pre-Top Compression Zone)
→ In every major cycle—2013, 2017, 2021—price consolidated beneath this band right before the final blow-off phase.
→ In 2025, BTC is again compressing inside the same zone.
This implies:
Bitcoin always “stalls” once before the true cycle top.
This stall is happening now.
C) Upper Red Band (Macro Top Territory)
→ All mega tops in 2013, 2017, and 2021 hit this exact red logarithmic curve.
→ The projection for the 2025–2026 cycle peaks lands here again:
185k – 260k.
The red curve marks the end of the road.
2) Cyclical Time Markers (Orange Vertical Lines): “The 1-Year rhythm repeats”
The orange verticals represent Bitcoin’s 1-year hybrid time geometry.
Every yearly block follows the same pattern:
Momentum compresses
Volatility dries up
RSI drifts toward the floor
Final trend expansion happens in the last 3–4 months
Right now, as we enter late 2025:
The time marker again aligns with a cyclical weakness window
Which historically precedes major upside expansions
This mirrors 2012, 2015, 2019, and 2023 perfectly.
The chart is saying:
“Your time window is closing. This is the reset before expansion.”
3) RSI at 32: “Cycle-bottom signal”
The horizontal red line tracks historical cycle-bottom RSI values.
An RSI in the 32–35 range marked:
2011 bottom
2015 bottom
2019 bottom
2023 bottom
In late 2025, RSI is back in the same zone.
This tells us:
The trend is not breaking; momentum is resetting.
This is the last cooldown before the expansion leg.
Bitcoin has never topped a macro cycle with weekly RSI this low.
Every blow-off top occurred with RSI between 70–90.
RSI is saying clearly:
“The cycle top is not in. This bull market is not finished.”
4) Price Behavior: “Compression beneath upper band = calm before ignition”
Bitcoin is currently:
Squeezed between the upper-mid grey band
And the upper red logarithmic curve
Forming the tightest consolidation since 2021
This structure resembles:
→ Mid-2016 (right before the 2017 parabolic run)
→ Summer 2020 (right before the 2021 surge)
Once again, BTC is behaving like a coiled spring—fully compressed, waiting for release.
5) Cyclical Projection (Cryptollica style):
Assuming historical structure repeats:
Short Term (1–3 months):
RSI bottom → sideways grind → momentum reversal
Medium Term (3–9 months):
Break above upper-mid band
→ explosive flow into 85k–110k range
→ sentiment flips fully bullish
Macro Top Window (first half of 2026):
Touch of the upper red band
→ 185k–260k macro top potential
This band has never failed across 3 full cycles.
----------------------------------------------------------------
This chart is not showing weakness.
It is showing a textbook cyclical reset.
**“The 2026 blow-off top hasn’t even started.
This is the final compression…
the final breath…
------------------------------
2013-2018
2021-2026
Disclaimer
The information and publications are not meant to be, and do not constitute, financial, investment, trading, or other types of advice or recommendations supplied or endorsed by TradingView. Read more in the Terms of Use.
Disclaimer
The information and publications are not meant to be, and do not constitute, financial, investment, trading, or other types of advice or recommendations supplied or endorsed by TradingView. Read more in the Terms of Use.