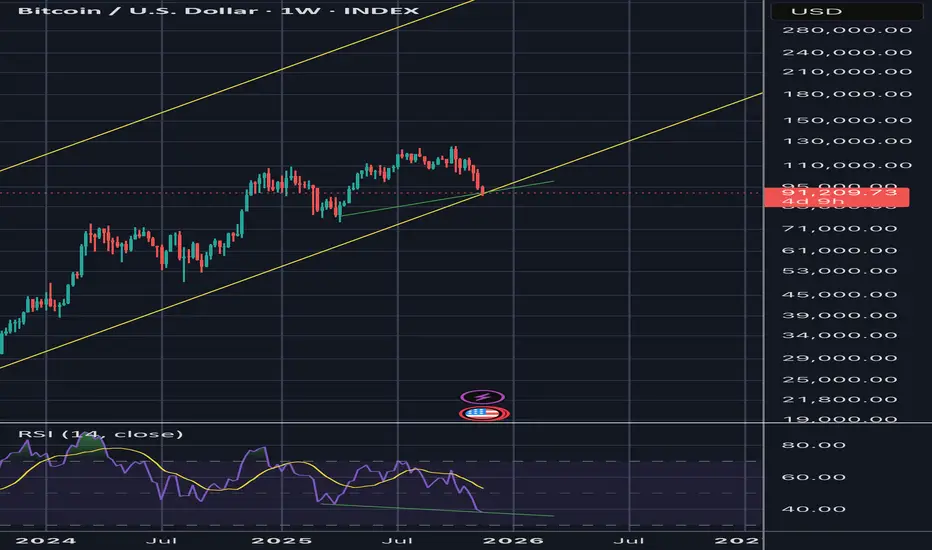
As shown by the green lines on the chart, early-stage bullish divergence may be forming on the Bitcoin (BTC/USD) weekly chart which:
- Signals a likely end-of-correction zone
- Suggests bull market structure still intact
- Aligns with cycle continuation, not a bear market start
Price and RSI turning upward are needed for confirmation.
Historically:
- 2013 mid-cycle correction with RSI bullish divergence led to a +400% run
- 2017 mid-cycle correction with RSI bullish divergence led to a +300% run
- 2020–2021 mid-cycle pullback with weekly RSI bullish divergence led to new ATH within months
In summary, BTC is likely forming a bottom right around this area, with potential for one more wick lower before reversal.
This is not investment advice. Be sure to do your own research.
Disclaimer
The information and publications are not meant to be, and do not constitute, financial, investment, trading, or other types of advice or recommendations supplied or endorsed by TradingView. Read more in the Terms of Use.
Disclaimer
The information and publications are not meant to be, and do not constitute, financial, investment, trading, or other types of advice or recommendations supplied or endorsed by TradingView. Read more in the Terms of Use.