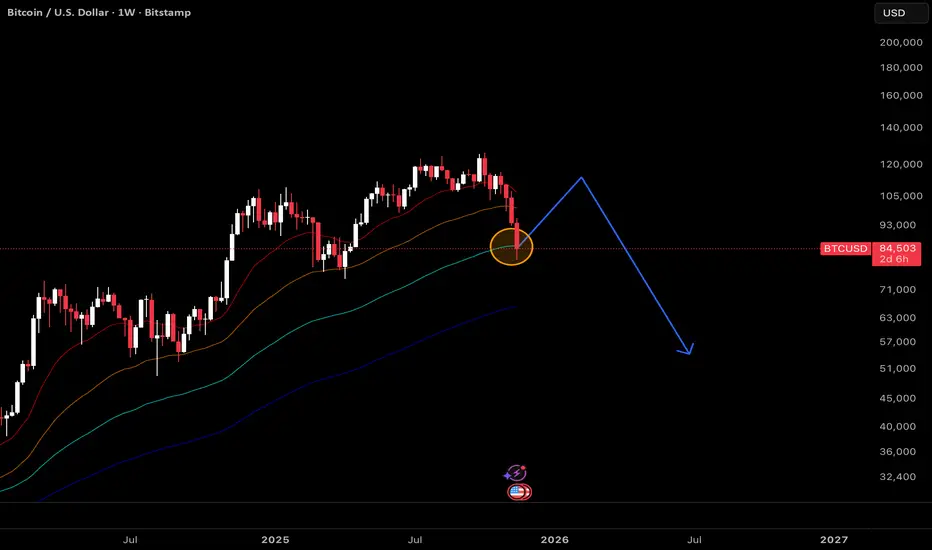
This chart analyzes the historical behavior of Bitcoin whenever price revisits the 100-week moving average (MA) during bull market phases. Historically, each tag of the 100-week MA after a strong run is followed by a relief rally—typically resulting in a lower high of about 40% off the MA touch.
However, these moves are often not the start of a new uptrend, but rather countertrend bounces that precede major bear market phases. This setup repeats across cycles: after the 100-week MA touch in a bull market, price frequently prints a significant lower high before breaking down further as broader bearish conditions take hold.
However, these moves are often not the start of a new uptrend, but rather countertrend bounces that precede major bear market phases. This setup repeats across cycles: after the 100-week MA touch in a bull market, price frequently prints a significant lower high before breaking down further as broader bearish conditions take hold.
Disclaimer
The information and publications are not meant to be, and do not constitute, financial, investment, trading, or other types of advice or recommendations supplied or endorsed by TradingView. Read more in the Terms of Use.
Disclaimer
The information and publications are not meant to be, and do not constitute, financial, investment, trading, or other types of advice or recommendations supplied or endorsed by TradingView. Read more in the Terms of Use.