⊣
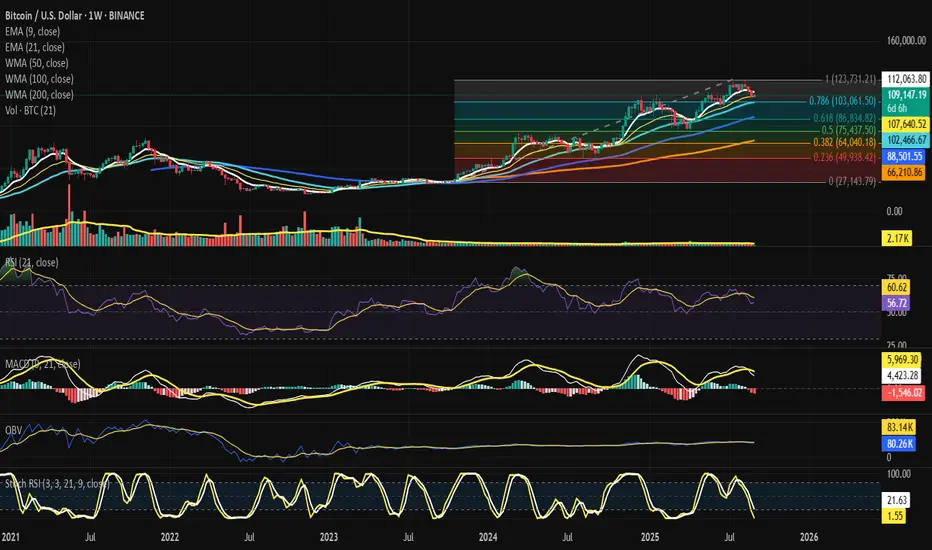
⟁ BTC/USD – BINANCE – (CHART: 1W) – (Sep 01, 2025).
◇ Analysis Price: $108,883.16.
⊣
⨀ I. Temporal Axis – Strategic Interval – (1W):
▦ EMA9 – $112,010.99:
∴ Price trades below EMA9, confirming weekly short-term weakness;
∴ Acts as dynamic resistance aligned with rejection candles;
∴ Bulls require a weekly close > EMA9 to regain strength.
✴️ Conclusion: EMA9 = first ceiling for recovery.
⊢
▦ EMA21 – $107,616.51:
∴ Price currently rests just above EMA21;
∴ EMA21 aligns with tactical support after EMA9 loss;
∴ Confluence with local structure reinforces as battle line.
✴️ Conclusion: EMA21 = current pivot, decisive for weekly trend.
⊢
▦ WMA50 – $102,456.32:
∴ Converges with Fib 0.786 ($103,061);
∴ Forms heavy support cluster;
∴ Break below exposes deeper retracement zones.
✴️ Conclusion: WMA50 + Fib 0.786 = structural shield.
⊢
▦ WMA100 – $88,496.32:
∴ Mid-term support level, far from spot;
∴ Safety net below Fib 0.618 ($86,834);
∴ Historical pivot in previous cycles.
✴️ Conclusion: WMA100 = mid-term structural base.
⊢
▦ WMA200 – $66,208.23:
∴ Ultimate macro support far below current action;
∴ Defines secular trend;
∴ Bears unlikely to reach without systemic capitulation.
✴️ Conclusion: WMA200 = macro foundation.
⊢
▦ RSI (21, close 9) – 56.57 / 60.59:
∴ RSI above 50 = positive bias, but descending from prior highs;
∴ Momentum weakening, approaching neutrality;
∴ No bullish divergence formed yet;
✴️ Conclusion: RSI fading, still positive but fragile.
⊢
▦ MACD (9,21,9) – Line: 4,394.48 / Signal: 5,963.54 / Histogram: –1,569.06:
∴ Bearish crossover confirmed;
∴ Histogram negative, momentum shifting bearish;
∴ Weekly timeframe signals mid-term risk.
✴️ Conclusion: MACD = bearish transition underway.
⊢
▦ OBV + EMA9 – OBV: 83.14K / EMA9: 80.26K:
∴ OBV above EMA9, reflecting prior accumulation;
∴ No expansion, flattening trajectory;
∴ Suggests distribution/neutral flows.
✴️ Conclusion: OBV steady but not supportive.
⊢
▦ Stoch RSI (3,3,21,9) – K: 1.09 / D: 21.48:
∴ In deep oversold (<20);
∴ Early cross attempt between K and D;
∴ Relief rally possible, not yet confirmed.
✴️ Conclusion: Oversold condition signals potential bounce.
⊢
▦ Fibonacci Retracement (0 = 27,143 -> 1 = 123,731):
✴️ Conclusion: $103k region = confluence fortress; loss exposes $86k.
⊢
🜎 Strategic Insight - Technical Oracle:
∴ The weekly structure is compressed between EMA9 ($112K) above and EMA21 ($107.6K) below, defining a narrow battlefield;
∴ Momentum tools diverge: RSI (56.6) still positive yet fading, while MACD confirms a bearish crossover, and Stoch RSI drifts in oversold territory;
∴ The confluence fortress at $103K (Fib 0.786 + WMA50) stands as the decisive defense; its loss would unlock the mid-cycle retracement path toward $86K (Fib 0.618 + WMA100);
∴ OBV above EMA9 indicates prior accumulation, but its flattening betrays absence of new inflows.
✴️ Conclusion: The weekly oracle confirms structural fragility: upside recovery demands a close >$112K, while downside destiny pulls toward ($103K if $107.6K) fails.
⊢
▦ CME Gap Analysis:
⌖
∴ CME daily chart highlights an open gap region in the ($112K -> $114K) zone - (from recent downside break);
∴ Historically, CME gaps tend to close with high probability, especially within 1–3 weeks;
∴ Current price ($109.4K) rests below this gap, leaving upside magnetism;
✴️ Conclusion: CME gap above acts as a gravitational pull; if price stabilizes >$108K, probability favors retrace into ($112 / $114K).
⊢
▦ Lower Gaps (Unresolved):
∴ Historical CME structure also leaves unfilled gap at ($103 / $104K) - (aligned with Fib 0.786 + WMA50 from weekly);
∴ This acts as downside magnet if $108K support fails;
∴ Market may oscillate between these dual magnets: ($103 / $104K) below, ($112 / $114K) above.
✴️ Conclusion: Dual CME gaps frame near-term battlefield; direction depends on structural defense of $108K.
⊢
𓂀 Stoic-Structural Interpretation – (BTC/USD + CME) - (Sep 01, 2025):
∴ Structure of Spot: Bitcoin clings to the Fib 0.382 ($108K), where the weekly EMA21 ($107.6K) marks the hinge of destiny. Above, the barrier of EMA9 ($112K) looms, resisting all relief. Below, the WMA50 + Fib 0.786 ($103K) stands as the fortress, the last shield before deeper descent;
∴ Structure of CME: The futures chart reveals the voids - an unclosed gap above ($112–114K) and another below ($103–104K). These voids are gravitational wells, pulling price toward their closure. Spot and CME converge: what the candle structure outlines, the gaps confirm.
∴ Momentum of Will: Indicators bear the stoic seal of decline. RSI fades from strength, MACD crosses bearish, and OBV flattens, whispering of distribution. Yet the Stoch RSI oversold breathes the faint promise of reprieve - not salvation, but respite.
∴ Fate of Flow: On-chain discipline shows no panic, whales remain silent; it is structure, not capitulation, that bends the market’s will. Thus, the battlefield is defined not by chaos but by the calm inevitability of compression between supports and voids.
✦ Structure Thus:
∴ Hold above $108K -> the path opens to the CME gap above ($112 / $114K), a short-term redemption;
∴ Fail below $107K -> the market is drawn into the CME gap below ($103 / $104K), aligning with the weekly fortress.
✴️ Conclusion: Bitcoin stands suspended between two voids - a promise above, a threat below. The stoic essence demands patience: fate will be decided by which gap the structure surrenders to first.
⊢
· Cryptorvm Dominvs · MAGISTER ARCANVM · Vox Primordialis ·
· Dominivm Cardo Gyratio Omnivm · Silence precedes the next force. Structure is sacred ·
⊢
⟁ BTC/USD – BINANCE – (CHART: 1W) – (Sep 01, 2025).
◇ Analysis Price: $108,883.16.
⊣
⨀ I. Temporal Axis – Strategic Interval – (1W):
▦ EMA9 – $112,010.99:
∴ Price trades below EMA9, confirming weekly short-term weakness;
∴ Acts as dynamic resistance aligned with rejection candles;
∴ Bulls require a weekly close > EMA9 to regain strength.
✴️ Conclusion: EMA9 = first ceiling for recovery.
⊢
▦ EMA21 – $107,616.51:
∴ Price currently rests just above EMA21;
∴ EMA21 aligns with tactical support after EMA9 loss;
∴ Confluence with local structure reinforces as battle line.
✴️ Conclusion: EMA21 = current pivot, decisive for weekly trend.
⊢
▦ WMA50 – $102,456.32:
∴ Converges with Fib 0.786 ($103,061);
∴ Forms heavy support cluster;
∴ Break below exposes deeper retracement zones.
✴️ Conclusion: WMA50 + Fib 0.786 = structural shield.
⊢
▦ WMA100 – $88,496.32:
∴ Mid-term support level, far from spot;
∴ Safety net below Fib 0.618 ($86,834);
∴ Historical pivot in previous cycles.
✴️ Conclusion: WMA100 = mid-term structural base.
⊢
▦ WMA200 – $66,208.23:
∴ Ultimate macro support far below current action;
∴ Defines secular trend;
∴ Bears unlikely to reach without systemic capitulation.
✴️ Conclusion: WMA200 = macro foundation.
⊢
▦ RSI (21, close 9) – 56.57 / 60.59:
∴ RSI above 50 = positive bias, but descending from prior highs;
∴ Momentum weakening, approaching neutrality;
∴ No bullish divergence formed yet;
✴️ Conclusion: RSI fading, still positive but fragile.
⊢
▦ MACD (9,21,9) – Line: 4,394.48 / Signal: 5,963.54 / Histogram: –1,569.06:
∴ Bearish crossover confirmed;
∴ Histogram negative, momentum shifting bearish;
∴ Weekly timeframe signals mid-term risk.
✴️ Conclusion: MACD = bearish transition underway.
⊢
▦ OBV + EMA9 – OBV: 83.14K / EMA9: 80.26K:
∴ OBV above EMA9, reflecting prior accumulation;
∴ No expansion, flattening trajectory;
∴ Suggests distribution/neutral flows.
✴️ Conclusion: OBV steady but not supportive.
⊢
▦ Stoch RSI (3,3,21,9) – K: 1.09 / D: 21.48:
∴ In deep oversold (<20);
∴ Early cross attempt between K and D;
∴ Relief rally possible, not yet confirmed.
✴️ Conclusion: Oversold condition signals potential bounce.
⊢
▦ Fibonacci Retracement (0 = 27,143 -> 1 = 123,731):
- 0.786 -> $103,061 (≈ WMA50);
- 0.618 -> $86,834 (≈ WMA100);
- 0.500 -> $75,437;
- 0.382 -> $64,040;
- 0.236 -> $49,938.
✴️ Conclusion: $103k region = confluence fortress; loss exposes $86k.
⊢
🜎 Strategic Insight - Technical Oracle:
∴ The weekly structure is compressed between EMA9 ($112K) above and EMA21 ($107.6K) below, defining a narrow battlefield;
∴ Momentum tools diverge: RSI (56.6) still positive yet fading, while MACD confirms a bearish crossover, and Stoch RSI drifts in oversold territory;
∴ The confluence fortress at $103K (Fib 0.786 + WMA50) stands as the decisive defense; its loss would unlock the mid-cycle retracement path toward $86K (Fib 0.618 + WMA100);
∴ OBV above EMA9 indicates prior accumulation, but its flattening betrays absence of new inflows.
✴️ Conclusion: The weekly oracle confirms structural fragility: upside recovery demands a close >$112K, while downside destiny pulls toward ($103K if $107.6K) fails.
⊢
▦ CME Gap Analysis:
⌖
∴ CME daily chart highlights an open gap region in the ($112K -> $114K) zone - (from recent downside break);
∴ Historically, CME gaps tend to close with high probability, especially within 1–3 weeks;
∴ Current price ($109.4K) rests below this gap, leaving upside magnetism;
✴️ Conclusion: CME gap above acts as a gravitational pull; if price stabilizes >$108K, probability favors retrace into ($112 / $114K).
⊢
▦ Lower Gaps (Unresolved):
∴ Historical CME structure also leaves unfilled gap at ($103 / $104K) - (aligned with Fib 0.786 + WMA50 from weekly);
∴ This acts as downside magnet if $108K support fails;
∴ Market may oscillate between these dual magnets: ($103 / $104K) below, ($112 / $114K) above.
✴️ Conclusion: Dual CME gaps frame near-term battlefield; direction depends on structural defense of $108K.
⊢
𓂀 Stoic-Structural Interpretation – (BTC/USD + CME) - (Sep 01, 2025):
∴ Structure of Spot: Bitcoin clings to the Fib 0.382 ($108K), where the weekly EMA21 ($107.6K) marks the hinge of destiny. Above, the barrier of EMA9 ($112K) looms, resisting all relief. Below, the WMA50 + Fib 0.786 ($103K) stands as the fortress, the last shield before deeper descent;
∴ Structure of CME: The futures chart reveals the voids - an unclosed gap above ($112–114K) and another below ($103–104K). These voids are gravitational wells, pulling price toward their closure. Spot and CME converge: what the candle structure outlines, the gaps confirm.
∴ Momentum of Will: Indicators bear the stoic seal of decline. RSI fades from strength, MACD crosses bearish, and OBV flattens, whispering of distribution. Yet the Stoch RSI oversold breathes the faint promise of reprieve - not salvation, but respite.
∴ Fate of Flow: On-chain discipline shows no panic, whales remain silent; it is structure, not capitulation, that bends the market’s will. Thus, the battlefield is defined not by chaos but by the calm inevitability of compression between supports and voids.
✦ Structure Thus:
∴ Hold above $108K -> the path opens to the CME gap above ($112 / $114K), a short-term redemption;
∴ Fail below $107K -> the market is drawn into the CME gap below ($103 / $104K), aligning with the weekly fortress.
✴️ Conclusion: Bitcoin stands suspended between two voids - a promise above, a threat below. The stoic essence demands patience: fate will be decided by which gap the structure surrenders to first.
⊢
· Cryptorvm Dominvs · MAGISTER ARCANVM · Vox Primordialis ·
· Dominivm Cardo Gyratio Omnivm · Silence precedes the next force. Structure is sacred ·
⊢
Trade active
⊣⟁ On-Chain Layer – Bitcoin MVRV Ratio + EMA21 (Sep 01, 2025) - (Source: CryptoQuant):
◇ MVRV Ratio: 2.05 | Spot: $109.1K.
⊣
▦ MVRV Ratio - Current Level (2.05):
∴ MVRV above 2.0 signals that investors, on average, hold ~105% unrealized profit over cost basis;
∴ Historically, zones > (2.0 / 2.5) often precede profit-taking and local corrections;
∴ Current level suggests market is not undervalued; pressure leans toward distribution.
✴️ Conclusion: MVRV at 2.05 reflects profit-rich environment -> bearish leaning.
⊢
▦ EMA21 Overlay on MVRV:
∴ Ratio trending below EMA21 since early August, showing momentum loss in profitability;
∴ EMA21 acts as mean line; sustained rejection indicates sellers outweigh hodler conviction;
∴ Reclaiming EMA21 would mark bullish renewal of profit trend.
✴️ Conclusion: EMA21 rejection confirms bearish momentum in valuation.
⊢
▦ Historical Context:
∴ MVRV <1 has marked cycle bottoms (capitulation zones, 2022);
∴ Current 2.05 sits mid-high band, not euphoric (>3.0) but stretched from fair value;
∴ Leaves room for further correction before reaching “neutral” (1.5 / 1.7) zone;
✴️ Conclusion: MVRV supports mid-cycle correction thesis. Logic sealed.
⊢
𓂀 Stoic-Structural Interpretation - MVRV Oracle:
∴ Structure: On-chain valuation rests above 2.0, aligned with historical profit-taking zones;
∴ Momentum: EMA21 overhead signals loss of bullish thrust; market bleeds structure, not panic;
∴ Fate: Unless MVRV reclaims EMA21, valuation logic dictates a drift toward neutral bands (1.5 / 1.7), aligning with technical supports at ($103K / $104K);
✴️ Conclusion: MVRV ratio confirms the stoic compression: not euphoric, not capitulative, but stretched. The will of structure bends downward until neutrality restores balance.
⊢
Related publications
Disclaimer
The information and publications are not meant to be, and do not constitute, financial, investment, trading, or other types of advice or recommendations supplied or endorsed by TradingView. Read more in the Terms of Use.
Related publications
Disclaimer
The information and publications are not meant to be, and do not constitute, financial, investment, trading, or other types of advice or recommendations supplied or endorsed by TradingView. Read more in the Terms of Use.