since most of the liquidity goes through binance, this will be the primary chart i will be using going forward. previously i was using the kukoin chart, as that's the exchange i use, but this morning i learned that nothing else matters except this binance chart.
----
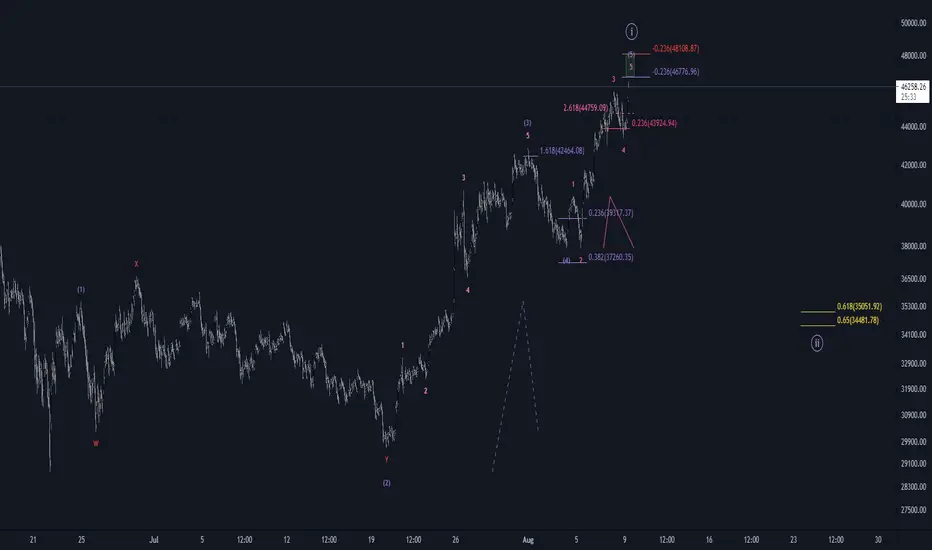
this last move on july 31st from 42885.28 ---> 37915.50 caught me off guard, and i bet i wasn't the only one.
the only chart that clearly shows what's going on is this binance chart, every single other exchange made a lower low for that move, which made things very confusing \ invalidated this larger picture.
this is the only scenario that i could possibly think of given the new data this morning.
looking for 47~48k to put in wave (1) on the higher degree, before the 0.618 wave (2) pullback to that 35k area.
this would in theory set us up for a much larger move to the upside.
----
this last move on july 31st from 42885.28 ---> 37915.50 caught me off guard, and i bet i wasn't the only one.
the only chart that clearly shows what's going on is this binance chart, every single other exchange made a lower low for that move, which made things very confusing \ invalidated this larger picture.
this is the only scenario that i could possibly think of given the new data this morning.
looking for 47~48k to put in wave (1) on the higher degree, before the 0.618 wave (2) pullback to that 35k area.
this would in theory set us up for a much larger move to the upside.
i only share a tiny fragment of my ideas on this platform. to view my daily work, join the lunar syndicate 9 👇
Disclaimer
The information and publications are not meant to be, and do not constitute, financial, investment, trading, or other types of advice or recommendations supplied or endorsed by TradingView. Read more in the Terms of Use.