Bitcoin Crash + Largest altcoin analysis requests! (ask me)Write a comment with your altcoin, and I will make an analysis for you in response! Also, please hit boost and follow for more ideas.
I start my analysis with Bitcoin. Currently, I expect a drop to 85k. We have a total of 3 unfilled FVGs (fair value gaps) below the current price, and this is a big deal. These gaps pretty much always tend to be filled. These are no gaps that occurred at the start of the uptrend (near 15k in 2022), but almost before the end of the uptrend (85k in 2024). This is a hugeeeee problem, and I assure you that bitcoin will go down sooner rather than later.
Today we also want to look at the RSI indicator. The RSI indicator is important mostly only on the 1m, 1H, 1D, 1W, and 1M charts. Do not use it on, for example, 15m or 2h charts. On the RSI indicator, we can see a bearish divergence because the price is making a higher high while the indicator is making a lower high. That's a huge sign of weakness.
Also, let's take a look at the moving averages. This is the daily chart, so let's use 50, 100, and 200. These periods are very popular among huge institutions and hedge funds. They mainly like to use 200 and 20. As we can see, the price is too far away from them, which is a sign that the market is overbought and we should wait for a correction. You want to buy at the support, not when the market has already made the move.
Currently I am bearish on Bitcoin. Profit target 1: 92,250, profit target 2: 85,350.
Write a comment with your altcoin, and I will make an analysis for you in response. Also, please hit boost and follow for more ideas. Trading is not hard if you have a good coach! This is not a trade setup, as there is no stop-loss or profit target. I share my trades privately. Thank you, and I wish you successful trades!
Elliott Wave

GOLD → False breakout of resistance. Is a correction coming?FX:XAUUSD on the background of CPI on Thursday passes into a rally and realization of consolidation. The price is testing the resistance of 2721 and forms a false breakout. Traders in anticipation of PPI
After the release of CPI, there is a 90% chance that the Fed will cut rates by 0.25% next week.
Gold hit a two-week high due to the Middle East, optimism over China's economic stimulus, CPI news.
PPI and weekly jobless claims data also remain in focus, which could provide new hints on further Fed policy easing and the direction of the US dollar ahead of next week's Fed meeting. Sentiment around the Fed and risk trends will continue to play a decisive role in gold price dynamics.
Technically, the price is in a global wide flat. A false breakdown of resistance is forming and a correction may form.
Resistance levels: 2721
Support levels: 2700, 2682
The retest did not allow the bulls to pass through the resistance. In the near future the price may test the nearest support and form a bullish correction from which further growth or fall will be initiated. We should also take into account today's news
Regards R. Linda!

Gold is Ready to Fall again!!!Gold ( OANDA:XAUUSD ) started to pump, as I expected in the previous post .
Gold is entering the Resistance zone($2,740-$2,708) and Potential Reversal Zone(PRZ) and approaching the Upper line of the Ascending Channel .
According to Elliott's wave theory , Gold is completing microwave 5 of the main wave C .
Also, Regular Divergence(RD-) between Consecutive Peaks .
I expect Gold to fall to at least the Support zone($2,670-$2,653) after breaking the lower line of the ascending channel.
⚠️Note: If Gold breaks the Resistance zone($2,740-$2,708), we can expect more pumps.⚠️
⚠️Note: Tomorrow's US indices can impact the Gold trend. (Today's US indices were all as Forecasted).⚠️
🔔Be sure to follow the updated ideas.🔔
Gold Analyze ( XAUUSD ), 1-hour time frame ⏰.
Do not forget to put Stop loss for your positions (For every position you want to open).
Please follow your strategy; this is just my idea, and I will gladly see your ideas in this post.
Please do not forget the ✅' like '✅ button 🙏😊 & Share it with your friends; thanks, and Trade safe.

Gold Analysis==>>Rising again==>>Short term!!!Gold ( OANDA:XAUUSD ) started to decline from the Resistance zone($2,740-$2,708) , as I expected in the ✅ previous post ✅.
Gold is moving in the Support zone($2,670-$2,653) and near the Potential Reversal Zone(PRZ) .
According to Elliott's wave theory , Gold is completing wave 5 .
Also, Regular Divergence(RD+) between Consecutive Valleys .
I expect Gold to start rising again from the PRZ and attack the Downtrend line ; if it breaks, we can expect further pumps .
⚠️Note: We should expect further decline if Gold breaks the Support zone($2,670-$2,653).⚠️
🔔Be sure to follow the updated ideas.🔔
Gold Analyze ( XAUUSD ), 1-hour time frame ⏰.
Do not forget to put Stop loss for your positions (For every position you want to open).
Please follow your strategy; this is just my idea, and I will gladly see your ideas in this post.
Please do not forget the ✅' like '✅ button 🙏😊 & Share it with your friends; thanks, and Trade safe.

MicroStrategy head and shoulders 4hr TF Clear head and shoulders forming struggled to break back up over the cloud. Within an Elliot wave ABC correction with a head and shoulders measured move into the golden pocket which is also a support resistance flip area

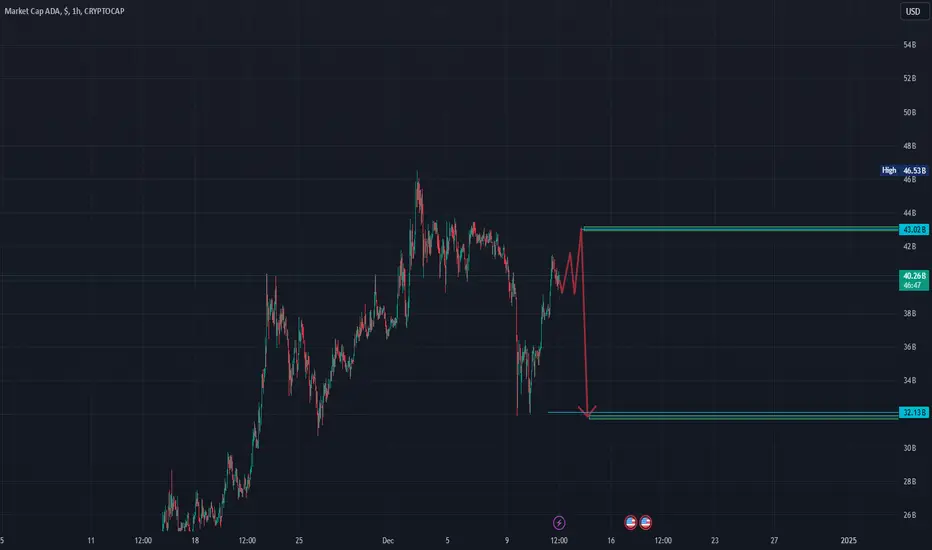
ADA H1ADA 1H
BINANCE:ADAUSDT
THIS following path will take place in this following week !
high trget will get touched first then low target
high target : $1.2011
low target : $0.91
GOLD → Retest 2720. CPI ahead, what to expect?FX:XAUUSD is coming out of a long consolidation and testing 2688. Bulls are trying to keep the defense above this zone, but the risks are increased by the publication of CPI...
Gold was boosted by the escalation of the conflict in the Middle East and renewed buying of gold reserves by China. Amid looming tariffs announced by Trump and weakening labor market conditions, the US inflation report will be crucial in determining the Fed's easing trajectory in the coming months.
Further upside for gold prices hinges on the release of US CPI data, which is likely to set the pace for US Fed action early next year.
Technically, gold is heading towards broad range resistance as well as the 2720 liquidity zone. The chances of reaching the target are high, but a sharp approach and high news volatility could trigger a false breakout.
Resistance levels: 2705, 2720
Support levels: 2688, 2675, 2658
The CPI data may trigger both a rise in the dollar and a deep correction, depending on the interpretation of the current US economy. Gold may react accordingly, but it all depends on the actual data.
Regards R. Linda!

AUDUSD_1D&1WAnalysis and review of the Australian dollar economy Elliott wave analysis style Mid-term and long-term time frames The Australian dollar is in a downward trend. The most important resistances are 0.67545 and 0.64611 Trading position from sell to buy The market is in a big ABC correction wave, we are currently in wave B. The main support and target is 0.60000.

Alienbase Short Term Trend ReversalAlienBase is showing strong signs of a trend reversal as it breaks out of a descending wedge,this breakout is supported by multiple confluences:
- A-B-C Correction Complete: The corrective phase has played out, paving the way for the next impulsive move.
- 50-Day EMA Support: Price has found solid support at the 50-day EMA, further reinforcing the bullish bias.
- Stochastic RSI: The Stoch RSI is crossing upward from oversold territory, signaling growing bullish momentum.
Momentum is building for a potential move toward the $0.50 area. If the breakout sustains with increasing volume, this could mark the beginning of a larger upward trend.
Key Levels to Watch:
Resistance: $0.50 (short-term target)
Support: $0.40 (breakout retest zone)

GOLD → False breakout and negative fundamental backgroundFX:XAUUSD is correcting after a false breakout of resistance. This is also supported by negative fundamentals. Will there be a pullback or will the decline continue?
Optimism over China's economic stimulus is waning amid growing fears of a trade war between the US and China. Expectations of a hawkish Fed interest rate next week helped boost the US dollar, leading to a corrective decline in the gold price.Markets now believe the Fed may send a hawkish signal by signaling a pause in January after PPI came in higher than expected
Technically gold is still inside the channel, consolidation continues. Focus on 2658-2660 support, below which there is a huge pool of liquidity that may not let the price down on the first try
Resistance levels: 2675, 2682, 2699
Support levels: 2658, 2636
From the support 2658 may form a correction from which will depend on the further development of events: if the correction will be small and the price will quickly return to 2658, it will increase the chances of support breakout and further fall, for example, to 2636. But, if gold can consolidate above 2682 and consolidate above the local high, the price may head for a retest of the high
Regards R. Linda!

TRIASTRIASUSDT (spot) - We mark the Elliot waves to define the next impulses and supported by the GANN and fibo grid, we devise the possibility of pushing this crypto to a very high ATH.

USDCHF → Breakout of wedge resistance. CPI aheadFX:USDCHF is showing positive signs of willingness to continue the uptrend. The dollar is consolidating in the meantime in anticipation of CPI, which creates risks for us
The currency pair is testing the support at 0.877 as part of the correction. A false breakdown and a reversal pattern is formed, which indicates the end of the correction. The price updates the local lows, and on the 4-hour timeframe it enters the realization phase after breaking the wedge resistance.
The focus is on 0.882 - 0.8848. If the bulls keep the defense above this zone even after the news, the growth of the currency pair will continue in the future, as the key liquidity zones are still untested
Resistance levels: 0.8848, 0.8887
Support levels: 0.882, 0.880
CPI is ahead and traders are not yet ready to take active action prematurely. The report may form a medium-term potential. A break of 0.8848 will be the trigger for continued upside. But, the structure will be broken if the market breaks 0.876
Regards R. Linda!

$SPY December 11, 2024AMEX:SPY December 11, 2024
15 Minutes.
Short still on.
For the last fall 606.44 to 602.14 61.8% retracement is 604-605 levels.
I expect resistance on retracement around those levels.
Since price below 200 averages downtrend intact in 15 minutes time frame.
On downside 599- 600 is a good level to cover short.
It is also 100 averages in 60 minutes time frame

Silver May Face More Weakness After A Corrective RallySilver is making sharp reversal down from recent highs, even breaking a lower trendline support of an ending diagonal which is an important indication for a top in place. As such, we are aware of much lower prices, maybe even back to the start of a diagonal at around 27/28 as drop from 4h time frame has an impulsive bearish structure into wave A/1.
But we see some bounce now that can be an A-B-C irregular/expanded flat correction into wave B/2, where subwave (C) can be now in progress. Resistance is then around 31.60-33 area, and from where we will have to be aware of further weakness within wave C or 3.

Super Micro Computer (SMCI): Is This the Greatest Comeback?Could this truly be the greatest comeback of 2024 & 2025? The decision for NASDAQ:SMCI is imminent, and it’s crucial to remain open to all potential scenarios.
Over the past month, NASDAQ:SMCI has risen by an impressive 83% and is now trading just below a significant resistance level. Flipping this resistance would mark the first shift from a bearish to a bullish structure since the beginning of the decline. Such a reclaim would also indicate a remarkable V-shaped correction, which holds substantial significance on the weekly chart.
It’s likely that NASDAQ:SMCI may experience a slight pullback this week to accumulate more buying momentum before pushing above the $50 mark. However, the stock must not fall below $25, as this remains the Point of Control (POC) since 2022—a critical level that must be respected to maintain the bullish potential.

USDJPY Is this the end of wave 4?The Elliott Wave Principle suggests a guideline of alternation between corrective waves, particularly between wave 2 and wave 4 of an impulsive wave sequence. This principle helps us identify the nature and behavior of these waves to better understand market structure.
These alternations may occur in many forms, for example: Nature of corrections (sharp or shallow), Depth of correction, Structure of correction (flat or triangle, combinations etc) and Time duration of correction (quick or longer corrections). The alternation helps us anticipate the likely form of wave 4 based on wave 2’s behavior to enhance forecasting accuracy.
So from these theory of alternation together with the rules around the wave principle, Looking at USDJPY at this level of price we have reached the deepest level of correction wave 4 can go. If the formation is correct, then wave 4 should not go beyond the red line. It made sense to me to take a short at the 50% fib retracement to tighten the SL however it is advisable to wait for confirmations, so saying I do believe there is still a plenty of chance for entry.

SANDUSDTAfter the descending channel breaks at the end of the big wave 2, I expect growth to the specified area in the long term.

GBPNZD Can Be Finishing The Wedge PatternGBPNZD pair has been trading bullish for the last 2 years or so, but since 2023 we can see that price action is slowing down and that bulls are running out of steam.
It came even higher recently and it's testing the highs of the year, but we are tracking an ending diagonal a.k.a. wedge pattern, which can be in final stages of 5th wave. If we are correct, then strong and sharp reversal will show up in 2025.
The ending diagonal (wedge) pattern is a special type of wave that occurs in wave 5 of an impulse or in wave C of a correction. An ending diagonal pattern is a type of pattern that can occur at the completion of a strong move. It reflects a “calming” of the market sentiment such that price still moves generally in the direction of the larger move, but not strongly enough to produce an impulsive wave. Ending diagonals consist of five waves, labeled 1-2-3-4-5, where each wave subdivides into three legs. Waves 1 and 4 overlap in price, while wave 3 can not be the shortest amongst waves 1, 3 and 5.
The reason why they are so interesting is because they are indicating a reversal, usually a strong one.

XAG/USD 12.12.2024FXOPEN:XAGUSD
Hello Traders,
After this bearish calculated move to the downside, we have now identified our wave 4 bottom. We expect higher prices in the coming days or weeks, likely forming either a 12345 setup or an ABC pattern from wave (4) to (5). Time will tell us what unfolds.

XAUUSD_1HShort and medium term gold analysis
Completing 5 rising and falling waves for Anas
Resistance number 2683
Target number and support 2670 and 2650
The main support in the long term is 2650 and the main resistance in the medium term is $2700.

Jasmy Blow Historic Wave 5Run it back turbo to $0.30?
Blow off Top Thesis and a historic wave 5.
Jasmy is the Japanese Bitcoin. Check out Japanase Metaplanet stock.
Japanese devs will perform suduko if the project doesn't work out. KPIs will be reached!
JASMY is the ADA of this cycle. Compare it to ADA 2019-2021 chart.
Search youtube for JASMY and all I see are left curvers supporting it.

XAU/USD 12.12.2024OANDA:XAUUSD
Hello Traders,
Today, we’re taking a closer look at gold. As expected, gold is moving down in an ABC structure (yellow) within our larger orange wave 4. From here, we can anticipate either a 12345 structure or, if the price moves sideways, another ABC structure leading up to wave 5.
Wave 4 has likely reached its bottom, though there is still a possibility of a further decline to the 61% Fibonacci level. However, I consider this scenario unlikely. Overall, we are once again looking for higher prices in the near future.

EURUSD → False breakout of resistance. DowntrendFX:EURUSD is testing resistance in the downtrend phase. The maneuver ends with a false breakout of resistance at 1.0607
On the daily timeframe the price is squeezed between the strong resistance at 1.06011 and the local support at 1.05. So, if the bears keep the defense below the key resistance, the currency pair will continue to fall in the short term. The target in this case may be the area of 1.05 - 1.044.
But, technically, the retest of 1.0607 may provoke a local breakout of the level and the price movement to the channel resistance against which there will also be a high probability of formation of a false breakout.
Resistance levels: 1.0607, 1.965, 1.076
Support levels: 1.0448, 1.0331
Emphasis on resistance. Confirmation of the nearest resistance in the form of price consolidation below the level, if retested, could be a good entry zone. But if resistance is broken, the focus will shift to 1.065 - 1.067
Rate, share your opinion and questions, let's discuss what's going on with ★ FX:EURUSD ;)
Regards R. Linda!
