In this guide I will explain the indecision candlestick patterns. The next subjects will be discussed:
- What are indecision candlestick patterns?
- What is the doji?
- What is the spinning top?
- What is the high wave candle?
What are indecision candlestick patterns?
Indecision candlestick patterns are formations on a price chart that suggest uncertainty in the market. They appear when neither buyers nor sellers have full control, meaning the price moves up and down during the trading period but closes near where it opened. This creates a candle with a small real body and often long wicks on either side, showing that the market explored both higher and lower prices but ended up not committing strongly in either direction. These patterns are often seen during periods when traders are waiting for more information before making bigger moves.
What is the doji?
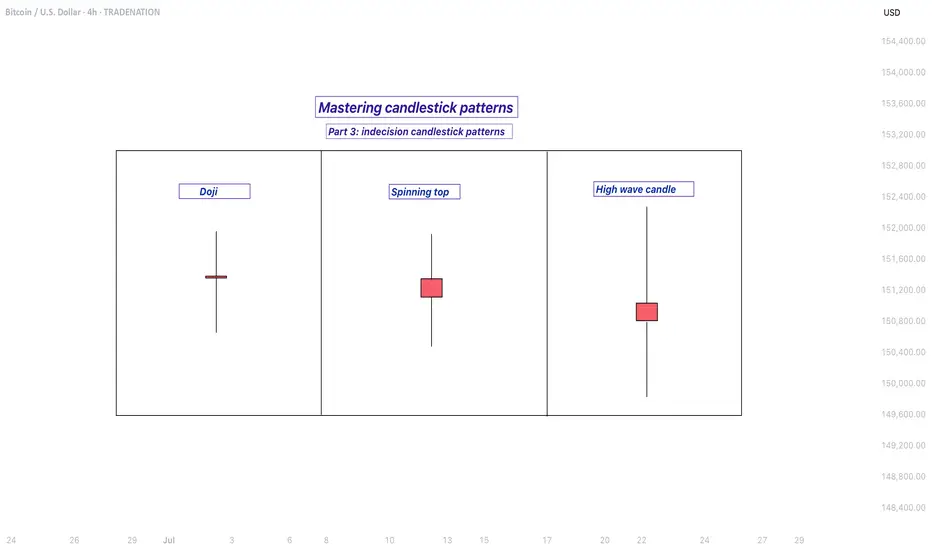
One of the most well-known indecision candles is the doji. A doji forms when the opening price and the closing price are almost identical, resulting in a very thin body. The wicks, which show the highest and lowest prices of the period, can be long or short depending on market activity. A doji tells us that buying and selling pressure were almost equal, which can happen during pauses in trends or before major reversals.

What is the spinning top?
Another type is the spinning top. A spinning top also has a small body, but unlike the doji, the open and close are not exactly the same. The wicks on both sides are typically of similar length, indicating that the market moved both up and down significantly before settling close to the starting point. This pattern reflects hesitation and a balanced struggle between bulls and bears.

What is the high wave candle?
The high wave candle is a more dramatic version of indecision. It has a small real body like the other patterns but features very long upper and lower shadows. This means the market swung widely in both directions during the period, but ultimately closed without making strong progress either way. The high wave candle signals strong volatility paired with uncertainty, which can often precede sharp moves once the market chooses a direction.

When you see these types of candles, they are essentially the market saying “I’m not sure yet.” They often appear at turning points or before big news events and can warn that the current trend may be losing strength. However, they are not guarantees of reversal or continuation on their own. Traders usually combine them with other technical signals or chart patterns to confirm whether the market will break out in one direction or the other.
-------------------------
Disclosure: I am part of Trade Nation's Influencer program and receive a monthly fee for using their TradingView charts in my analysis.
Thanks for your support. If you enjoyed this analysis, make sure to follow me so you don't miss the next one. And if you found it helpful, feel free to drop a like 👍 and leave a comment 💬, I’d love to hear your thoughts!
- What are indecision candlestick patterns?
- What is the doji?
- What is the spinning top?
- What is the high wave candle?
What are indecision candlestick patterns?
Indecision candlestick patterns are formations on a price chart that suggest uncertainty in the market. They appear when neither buyers nor sellers have full control, meaning the price moves up and down during the trading period but closes near where it opened. This creates a candle with a small real body and often long wicks on either side, showing that the market explored both higher and lower prices but ended up not committing strongly in either direction. These patterns are often seen during periods when traders are waiting for more information before making bigger moves.
What is the doji?
One of the most well-known indecision candles is the doji. A doji forms when the opening price and the closing price are almost identical, resulting in a very thin body. The wicks, which show the highest and lowest prices of the period, can be long or short depending on market activity. A doji tells us that buying and selling pressure were almost equal, which can happen during pauses in trends or before major reversals.
What is the spinning top?
Another type is the spinning top. A spinning top also has a small body, but unlike the doji, the open and close are not exactly the same. The wicks on both sides are typically of similar length, indicating that the market moved both up and down significantly before settling close to the starting point. This pattern reflects hesitation and a balanced struggle between bulls and bears.
What is the high wave candle?
The high wave candle is a more dramatic version of indecision. It has a small real body like the other patterns but features very long upper and lower shadows. This means the market swung widely in both directions during the period, but ultimately closed without making strong progress either way. The high wave candle signals strong volatility paired with uncertainty, which can often precede sharp moves once the market chooses a direction.
When you see these types of candles, they are essentially the market saying “I’m not sure yet.” They often appear at turning points or before big news events and can warn that the current trend may be losing strength. However, they are not guarantees of reversal or continuation on their own. Traders usually combine them with other technical signals or chart patterns to confirm whether the market will break out in one direction or the other.
-------------------------
Disclosure: I am part of Trade Nation's Influencer program and receive a monthly fee for using their TradingView charts in my analysis.
Thanks for your support. If you enjoyed this analysis, make sure to follow me so you don't miss the next one. And if you found it helpful, feel free to drop a like 👍 and leave a comment 💬, I’d love to hear your thoughts!
🔸 Free trading Discord
discord.gg/fVfJHHQSMG
🔹 Free trading signals
t.me/CandleCollective
discord.gg/fVfJHHQSMG
🔹 Free trading signals
t.me/CandleCollective
Related publications
Disclaimer
The information and publications are not meant to be, and do not constitute, financial, investment, trading, or other types of advice or recommendations supplied or endorsed by TradingView. Read more in the Terms of Use.