PRICE ACTION
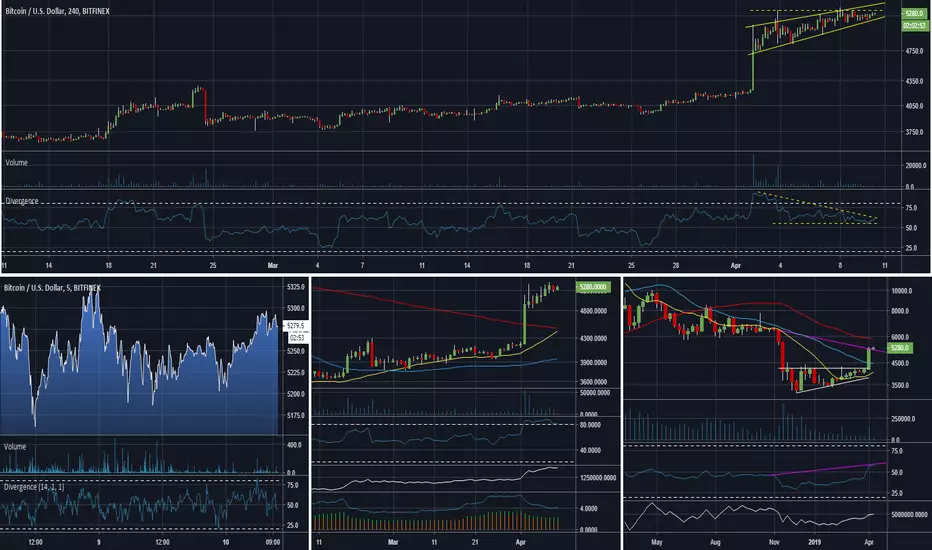
BTC has remained in the lower half of its rising pattern as $5250 continues to be resistive. Looking at the 1D chart, the indecision candle was followed by a red daily close; although volume has been weak on both sides.
Over the last 24 hours; the 5m chart shows price has ranged between 5150-5300 and RSI has predominantly been below 50. Factor this with the bearish divergence on the 4H chart; and the analysis continues to tend towards the downside.
OPEN INTERESTS (BITFINEX)
Long: 2.38 Days
Short: 1.71 Days
RELATIVE STRENGTHS
ON BALANCE VOLUME
KEY PRICE AREAS
Resistance: 5350, 5821 (52W MA), 6200
Support: 4880, 4437 (26W MA), 4412 (28D MA)
PREVIOUS ANALYSIS
BTC has remained in the lower half of its rising pattern as $5250 continues to be resistive. Looking at the 1D chart, the indecision candle was followed by a red daily close; although volume has been weak on both sides.
Over the last 24 hours; the 5m chart shows price has ranged between 5150-5300 and RSI has predominantly been below 50. Factor this with the bearish divergence on the 4H chart; and the analysis continues to tend towards the downside.
OPEN INTERESTS (BITFINEX)
Long: 2.38 Days
Short: 1.71 Days
RELATIVE STRENGTHS
- Micro (5m): Weak
- Short Term (4h): Bearish Divergence
- Mid Term (1D): Overbought
- Macro (1W): Hidden Bearish
ON BALANCE VOLUME
- Mid Term (1D): Higher
- Macro (1W): Lower
KEY PRICE AREAS
Resistance: 5350, 5821 (52W MA), 6200
Support: 4880, 4437 (26W MA), 4412 (28D MA)
PREVIOUS ANALYSIS
Disclaimer
The information and publications are not meant to be, and do not constitute, financial, investment, trading, or other types of advice or recommendations supplied or endorsed by TradingView. Read more in the Terms of Use.
Disclaimer
The information and publications are not meant to be, and do not constitute, financial, investment, trading, or other types of advice or recommendations supplied or endorsed by TradingView. Read more in the Terms of Use.