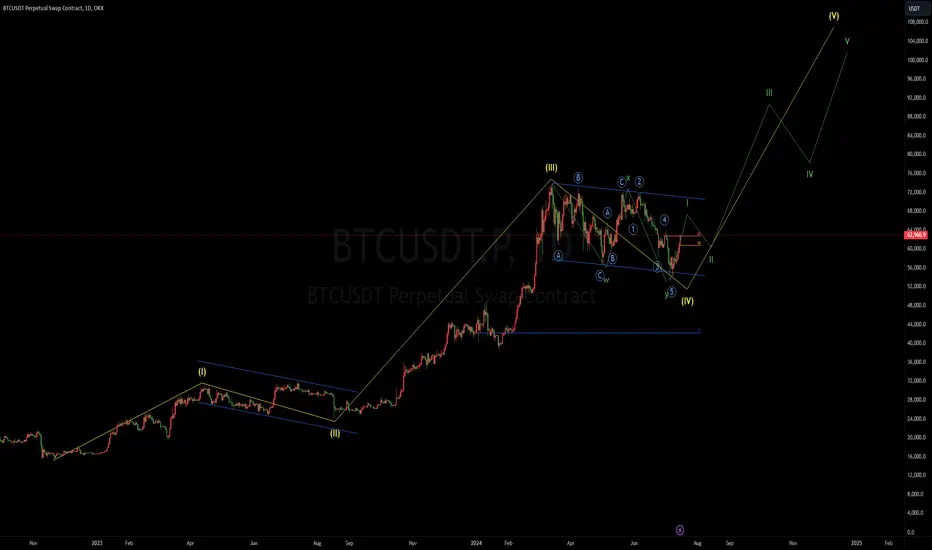
Bitcoin daily chart level wave count: The yellow fourth wave is a bull flag with a high probability, which has been completed. It takes a long time and has a complex structure. The previous two waves are also bull flags, which are simple and short, and run in an opposite way to the fourth wave. From the structure of the yellow fourth wave sub-wave green WXY wave, the green Y wave 5 should be over. At the same time, the structure of the yellow fourth wave is a consolidation divergence according to the entanglement theory. At present, the more stable way is to wait for a breakthrough of 64,000 and to effectively stand above 64,000. Go long on the right side. If it reaches 67,000 later, it means that the yellow fifth wave has begun.
Related publications
Disclaimer
The information and publications are not meant to be, and do not constitute, financial, investment, trading, or other types of advice or recommendations supplied or endorsed by TradingView. Read more in the Terms of Use.
Related publications
Disclaimer
The information and publications are not meant to be, and do not constitute, financial, investment, trading, or other types of advice or recommendations supplied or endorsed by TradingView. Read more in the Terms of Use.