BTC TECHNICAL ANALYSIS — GLOBAL CYCLE, FIBONACCI, MACD & SCENARI
1. Global Overview
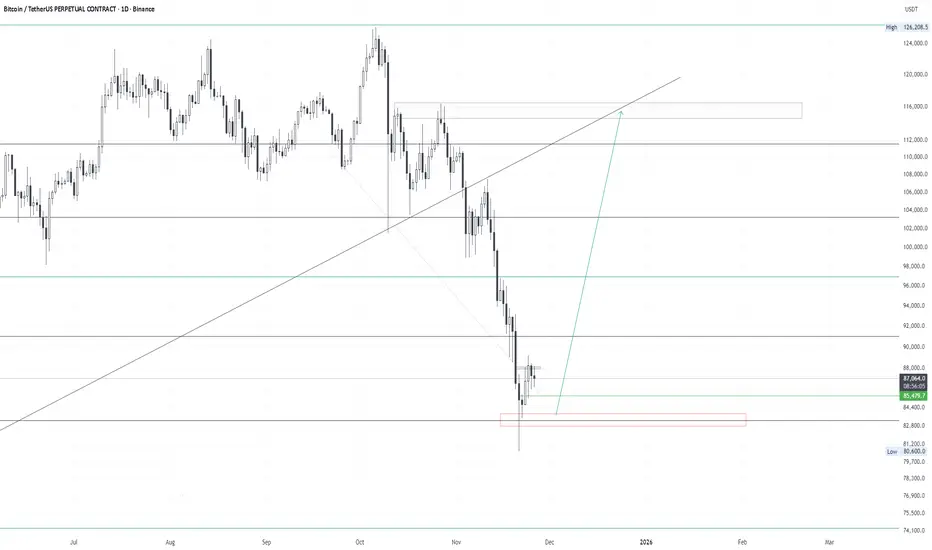
Bitcoin has completed one of the strongest multi-year bullish cycles, starting from $16,000, followed by a sequence of major impulses and deep pullbacks:
- Rally 16k → 73k
- Correction 73k → 49k
- Rally 49k → 108k
- Correction 108k → 74k
- Final impulse 74k → 126k
The move to 126k represents the final phase of the bullish cycle before a potential macro reversal.
2. Bearish Monthly MACD Signal
On the 1-month timeframe, a clear bearish MACD cross appeared in early October — historically this signal always led to a strong mid-term bear market.
Important:
The MACD signal formed before the final push to 126k,
Price made a minor higher high 123k → 126k,
then started dropping sharply.
This matches previous cycle reversals.
3. Current Position: 0.786 Fibonacci Zone
Using Fibonacci retracement of the last impulse (74k → 126k), the key deep correction level is:
📍 83,415$ — 0.786 Fib
Current price action:
Price broke below the level on the daily,
Then reclaimed it, suggesting a potential short-term bounce.
4. Outlook for December
December likely begins with:
- a small dip / retest into 83k,
- followed by a corrective upward move.
Target for the recovery:
🎯 114,000 – 115,000$
This is the optimal zone where the correction may finish.
5. Main Outlook for 2026
Because the monthly MACD signal is strongly bearish, and historically has always marked the start of a macro downtrend:
Expectations:
After the bounce, BTC will reverse downward again,
Breaking the previous lows.
Long-term targets:
🔥 53,000 – 45,000$
This is the likely completion zone of the upcoming bear cycle.
SUMMARY
- BTC is in a deep retracement zone,
- A bounce toward 114–115k is likely,
But long-term structure suggests continuation of the bear market.
Only First
Disclaimer
The information and publications are not meant to be, and do not constitute, financial, investment, trading, or other types of advice or recommendations supplied or endorsed by TradingView. Read more in the Terms of Use.
Only First
Disclaimer
The information and publications are not meant to be, and do not constitute, financial, investment, trading, or other types of advice or recommendations supplied or endorsed by TradingView. Read more in the Terms of Use.