Is the Bullrun Over? Time to Dive Down?
Weekly Supertrend Turns Bearish After ~1043 Days — What This Means for BTC
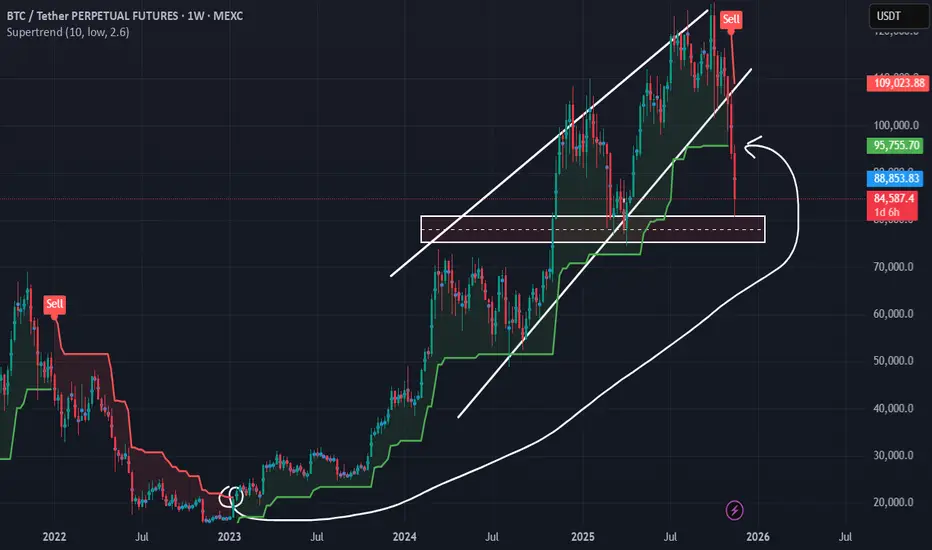
The crypto market is flashing serious warning signals, and one of the most important comes from the weekly Supertrend indicator. Using the parameters ATR Length = 10 and ATR Multiplier = 2.6 , the Supertrend has now flipped bearish again — and notably, this is happening after roughly 1043 days of staying on the bullish side.
On higher timeframes like the 'weekly chart', a Supertrend flip is not a short-term signal. It typically represents a **macro shift in market structure**, and such shifts don’t resolve quickly. When a weekly Supertrend turns bearish after such an extended bullish period, the market often enters a prolonged phase of consolidation or decline.
In other words:
This is not a dip — it’s a structural warning.
Price is likely to stay in weakness for a long time unless a major reversal invalidates the signal.
#The Critical Range: 75,100 – 80,750
I’ve drawn a key horizontal range between:
Lower bound: 75,100
Upper bound: 80,750
This is the zone BTC is likely to **test and re-test** while the weekly Supertrend stays bearish.
#Why this range matters:
* It served as a **liquidity pocket** and structural support.
* It aligns with price memory where strong bids previously entered.
* With weekly momentum now flipping negative, price will likely **grind into this zone** as buyers attempt to defend it.
Expect choppy, frustrating, sideways price action — ranging, wicking, and retesting — as the market decides whether the bull cycle can resume or not.
# If This Range Breaks… Things Could Turn Ugly
The real concern comes if BTC **breaks below 75,100** with conviction.
A breakdown from this range would mean:
* The weekly Supertrend remains firmly bearish.
* Market structure shifts from **distribution to full decline**.
* Long-term holders start derisking.
* Liquidity gaps below begin opening up.
### If 75,100 fails, BTC is not just correcting — it is entering a very, very extended downtrend
You could see:
* Multi-month decline
* Slow bleed into macro supports
* Possible cycle-top confirmation
This wouldn’t be a quick drop; it would be the start of a **long, grinding bearish phase** — similar to previous cycle tops where the market slowly unwound months of overextension.
# Conclusion
The weekly Supertrend (ATR 10, Multiplier 2.6) flipping bearish after ~1043 days is a **major macro signal**, not a noise event. BTC is likely to:
1. Stay weak for an extended period,
2. Range between 75,100 and 80,750,
3. Retest that zone multiple times, and
4. Potentially start a very long bearish phase if the range breaks to the downside.
This is the first genuine macro warning we’ve had in a long time — and the market is finally reacting to it.
Note: This analysis on BTC Market with Price Action and SuperTrend of mine is polished and made ready to publish by ChatGPT, but the key idea and analysis data was given manually
Asif Hassan Risan
23 November,2025
Weekly Supertrend Turns Bearish After ~1043 Days — What This Means for BTC
The crypto market is flashing serious warning signals, and one of the most important comes from the weekly Supertrend indicator. Using the parameters ATR Length = 10 and ATR Multiplier = 2.6 , the Supertrend has now flipped bearish again — and notably, this is happening after roughly 1043 days of staying on the bullish side.
On higher timeframes like the 'weekly chart', a Supertrend flip is not a short-term signal. It typically represents a **macro shift in market structure**, and such shifts don’t resolve quickly. When a weekly Supertrend turns bearish after such an extended bullish period, the market often enters a prolonged phase of consolidation or decline.
In other words:
This is not a dip — it’s a structural warning.
Price is likely to stay in weakness for a long time unless a major reversal invalidates the signal.
#The Critical Range: 75,100 – 80,750
I’ve drawn a key horizontal range between:
Lower bound: 75,100
Upper bound: 80,750
This is the zone BTC is likely to **test and re-test** while the weekly Supertrend stays bearish.
#Why this range matters:
* It served as a **liquidity pocket** and structural support.
* It aligns with price memory where strong bids previously entered.
* With weekly momentum now flipping negative, price will likely **grind into this zone** as buyers attempt to defend it.
Expect choppy, frustrating, sideways price action — ranging, wicking, and retesting — as the market decides whether the bull cycle can resume or not.
# If This Range Breaks… Things Could Turn Ugly
The real concern comes if BTC **breaks below 75,100** with conviction.
A breakdown from this range would mean:
* The weekly Supertrend remains firmly bearish.
* Market structure shifts from **distribution to full decline**.
* Long-term holders start derisking.
* Liquidity gaps below begin opening up.
### If 75,100 fails, BTC is not just correcting — it is entering a very, very extended downtrend
You could see:
* Multi-month decline
* Slow bleed into macro supports
* Possible cycle-top confirmation
This wouldn’t be a quick drop; it would be the start of a **long, grinding bearish phase** — similar to previous cycle tops where the market slowly unwound months of overextension.
# Conclusion
The weekly Supertrend (ATR 10, Multiplier 2.6) flipping bearish after ~1043 days is a **major macro signal**, not a noise event. BTC is likely to:
1. Stay weak for an extended period,
2. Range between 75,100 and 80,750,
3. Retest that zone multiple times, and
4. Potentially start a very long bearish phase if the range breaks to the downside.
This is the first genuine macro warning we’ve had in a long time — and the market is finally reacting to it.
Note: This analysis on BTC Market with Price Action and SuperTrend of mine is polished and made ready to publish by ChatGPT, but the key idea and analysis data was given manually
Asif Hassan Risan
23 November,2025
Disclaimer
The information and publications are not meant to be, and do not constitute, financial, investment, trading, or other types of advice or recommendations supplied or endorsed by TradingView. Read more in the Terms of Use.
Disclaimer
The information and publications are not meant to be, and do not constitute, financial, investment, trading, or other types of advice or recommendations supplied or endorsed by TradingView. Read more in the Terms of Use.