## 🟠 BTCUSDT Reversal Play: My High-Probability Short Setup with Defined Risk
### 🧠 Why I’m Taking This Trade
I’m positioning for a **short trade** on BTCUSDT after observing a sharp upward move followed by signs of exhaustion and a potential reversal. The recent rally pushed price into a zone where I expect sellers to step in. My goal is to catch the retracement while keeping risk tightly controlled.
I’m entering between **92,284.5 and 92,826.5**, which is a zone I’ve identified as a likely turning point. This area aligns with previous resistance and shows signs of rejection on lower timeframes.
### 🔍 What I’m Seeing on the Chart
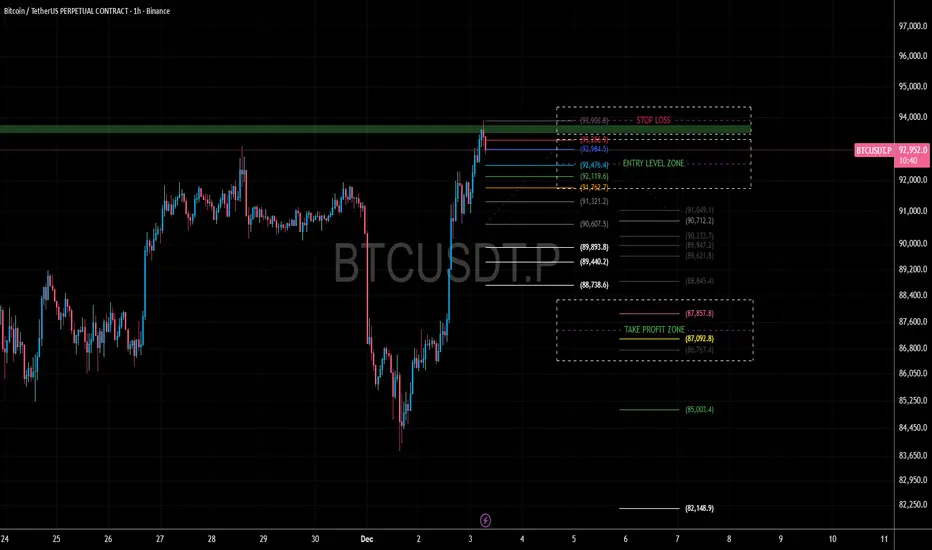
- **Current Price**: 92,897.6
- **Recent High**: 93,903.8
- **Entry Zone**: 92,284.5 to 92,826.5
- **Stop Loss**: 93,903.8
This is placed just above the recent high to protect against a breakout continuation.
- **Take Profit Zone**: 86,767.4 to 87,857.8
These levels are based on prior support zones and Fibonacci retracement targets.
### 📊 Risk vs Reward
This setup offers a strong edge. I’m risking about **1,077 points** (from 92,826.5 to 93,903.8) to potentially gain **4,969 to 6,059 points** (down to the TP zone). That gives me a **risk-reward ratio between 4.6 and 5.6**, which is excellent for a swing short.
### 🧭 My Strategy in Simple Terms
- I’m not shorting blindly—I’m waiting for price to enter a zone where sellers have previously shown strength.
- My stop is placed above the recent high, so if price breaks that level, I know the setup is invalid.
- My targets are realistic and based on previous support zones where buyers may re-enter.
This is a **structured, disciplined trade** with clear boundaries. I’m not guessing—I’m following a plan based on price behavior, structure, and risk control.
### 🧠 Why I’m Taking This Trade
I’m positioning for a **short trade** on BTCUSDT after observing a sharp upward move followed by signs of exhaustion and a potential reversal. The recent rally pushed price into a zone where I expect sellers to step in. My goal is to catch the retracement while keeping risk tightly controlled.
I’m entering between **92,284.5 and 92,826.5**, which is a zone I’ve identified as a likely turning point. This area aligns with previous resistance and shows signs of rejection on lower timeframes.
### 🔍 What I’m Seeing on the Chart
- **Current Price**: 92,897.6
- **Recent High**: 93,903.8
- **Entry Zone**: 92,284.5 to 92,826.5
- **Stop Loss**: 93,903.8
This is placed just above the recent high to protect against a breakout continuation.
- **Take Profit Zone**: 86,767.4 to 87,857.8
These levels are based on prior support zones and Fibonacci retracement targets.
### 📊 Risk vs Reward
This setup offers a strong edge. I’m risking about **1,077 points** (from 92,826.5 to 93,903.8) to potentially gain **4,969 to 6,059 points** (down to the TP zone). That gives me a **risk-reward ratio between 4.6 and 5.6**, which is excellent for a swing short.
### 🧭 My Strategy in Simple Terms
- I’m not shorting blindly—I’m waiting for price to enter a zone where sellers have previously shown strength.
- My stop is placed above the recent high, so if price breaks that level, I know the setup is invalid.
- My targets are realistic and based on previous support zones where buyers may re-enter.
This is a **structured, disciplined trade** with clear boundaries. I’m not guessing—I’m following a plan based on price behavior, structure, and risk control.
Disclaimer
The information and publications are not meant to be, and do not constitute, financial, investment, trading, or other types of advice or recommendations supplied or endorsed by TradingView. Read more in the Terms of Use.
Disclaimer
The information and publications are not meant to be, and do not constitute, financial, investment, trading, or other types of advice or recommendations supplied or endorsed by TradingView. Read more in the Terms of Use.