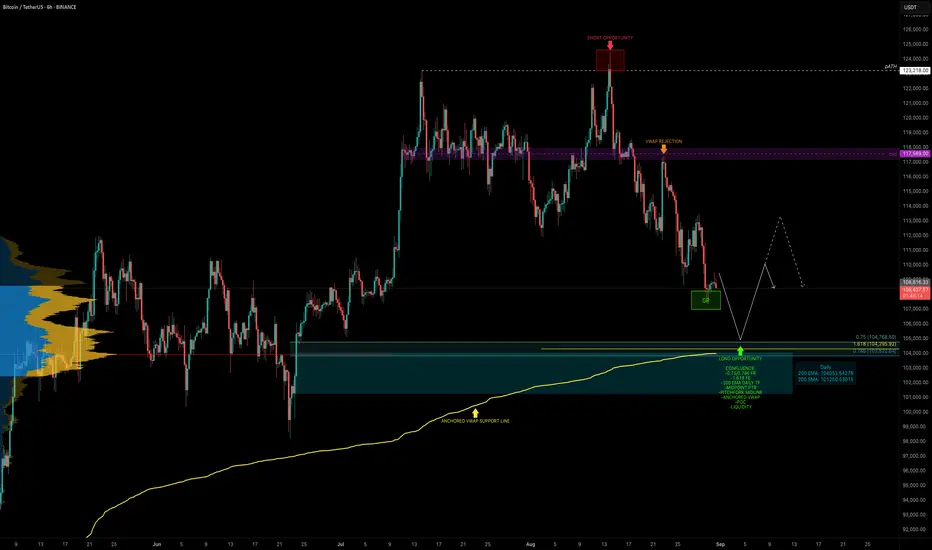
BTC has been in a 17-day downtrend since the swing failure at the ATH (~$124.5K). That move acted as both a bull trap and the completion of a 5-wave structure, offering an excellent short entry at the highs.
Now the key question: where is BTC heading next, and where is the next high-probability trade setup?
Current Situation
BTC is sitting at the 0.618 Fib retracement ($108,236) of the move from $98.2K → $124.5K. Many traders are already buying this level, which is valid but a deeper zone below offers stronger confluence.
🧩 Confluence Zone: $105K–$104K
This creates a high-confluence support cluster between $105K–$104K, making it the next strong long setup.
🟢 Long Trade Setup
Technical Insight
🔍 Indicators used
➡️ Available for free. You can find it on my profile under “Scripts” and apply it directly to your charts for extra confluence when planning your trades.
_________________________________
💬 If you found this helpful, drop a like and comment!
Now the key question: where is BTC heading next, and where is the next high-probability trade setup?
Current Situation
BTC is sitting at the 0.618 Fib retracement ($108,236) of the move from $98.2K → $124.5K. Many traders are already buying this level, which is valid but a deeper zone below offers stronger confluence.
🧩 Confluence Zone: $105K–$104K
- POC of the previous trading range → ~$104K
- 0.75 Fib retracement: $104,768.5
- 0.786 Fib retracement: $103,823
- Anchored VWAP (from swing low $74,508) → just above the 0.786 Fib
- Midpoint of the previous 60-day range
- Liquidity cluster → positioned around $105K–$104K
- 1.618 Fib extension target: $104,296
- Pitchfork midline → supporting this level
- 200 EMA (daily) → adding dynamic support at ~$104K
This creates a high-confluence support cluster between $105K–$104K, making it the next strong long setup.
🟢 Long Trade Setup
- Entry Zone: $106K–$104K
- Stop-Loss: Below $103K
- TP: $110K-$114K
- R:R Potential: 1:2+
Technical Insight
- The ATH rejection confirmed both bullish exhaustion and a completed 5-wave move, triggering the current correction.
- While the 0.618 retracement offers valid support, the $105K–$104K zone holds significantly stronger confluence.
- This makes it the most attractive high-probability long entry zone in the current structure.
🔍 Indicators used
- Multi Timeframe 8x MA Support Resistance Zones [SiDec] → to identify support and resistance zones such as the daily 200 EMA/SMA.
➡️ Available for free. You can find it on my profile under “Scripts” and apply it directly to your charts for extra confluence when planning your trades.
_________________________________
💬 If you found this helpful, drop a like and comment!
Order cancelled
BTC found support at the golden pocket and bounced.The ideal long entry at ~105K wasn’t reached
🏆 Mastering Fibonacci for precision trading
🔹 Sharing high-probability trade setups
⚡ Unlock the power of technical analysis!
🔹 Sharing high-probability trade setups
⚡ Unlock the power of technical analysis!
Related publications
Disclaimer
The information and publications are not meant to be, and do not constitute, financial, investment, trading, or other types of advice or recommendations supplied or endorsed by TradingView. Read more in the Terms of Use.