BTCUSDT Weekly Chart Analysis | Bullish V-Pattern Breakout Possible
🔍 Let’s dive into the Bitcoin/USDT weekly setup and map out the current momentum, focusing on a key bullish scenario as price nears decisive levels.
⏳ Weekly Overview
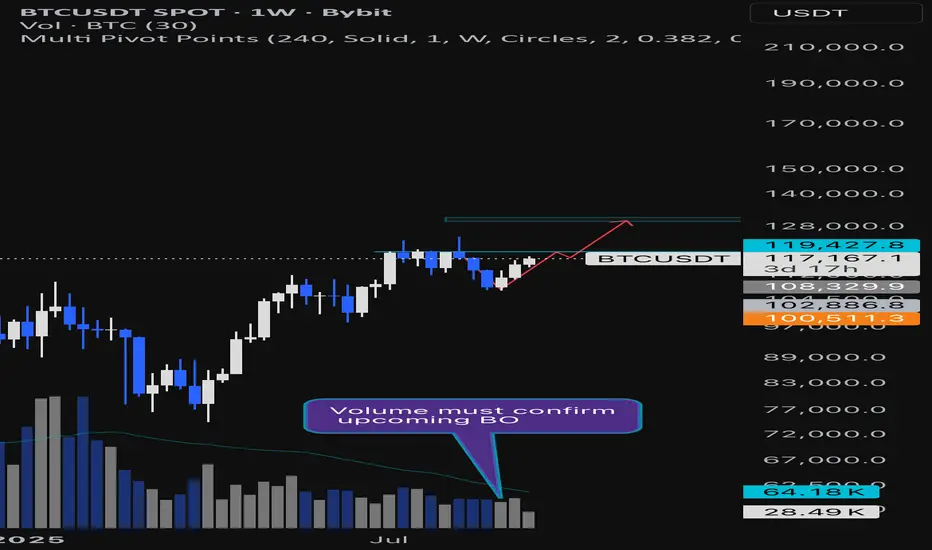
Bitcoin is trading near $119,427, just below a major resistance zone at $119,430. A confirmed weekly close above this level, accompanied by sustained volume, would activate a textbook bullish V-pattern breakout. The V bottom structure is recognized for its aggressive buying pressure — price first sharply reverses from the support zone, then rallies as bulls take control, validated by both price and volume signals.
🔺 Long Setup:
A strong volume-backed weekly close above $119,430 unlocks a 10% move at RR1, projecting further upside toward the next reachable target at $130,000, which acts as a Potential Reversal Zone (PRZ). The setup relies on clean confirmation: breakout, high volume on the weekly, and consolidation above resistance for sustained momentum.
📊 Key Highlights:
- Weekly V-pattern maturation can drive a strong bullish leg if confirmed above $119,430.
- Volume confirmation is vital: look for above-average weekly bars to validate breakout strength.
- Target zone sits at $130k, an area with clustering past liquidity and technical importance (PRZ).
- If the breakout stalls or is rejected, expect price to retest lower bands; first support now sits at $113,000–115,000.
🚨 Conclusion:
A bullish scenario is building, hinging on a weekly close with volume above $119,430. Such confirmation would validate a breakout from the V-pattern and set sights on $130k, where trend participants may look to realize or reassess positioning. Failure at this level could reload bids at key lower supports. Stay sharp for volume cues and structural follow-through.
🔍 Let’s dive into the Bitcoin/USDT weekly setup and map out the current momentum, focusing on a key bullish scenario as price nears decisive levels.
⏳ Weekly Overview
Bitcoin is trading near $119,427, just below a major resistance zone at $119,430. A confirmed weekly close above this level, accompanied by sustained volume, would activate a textbook bullish V-pattern breakout. The V bottom structure is recognized for its aggressive buying pressure — price first sharply reverses from the support zone, then rallies as bulls take control, validated by both price and volume signals.
🔺 Long Setup:
A strong volume-backed weekly close above $119,430 unlocks a 10% move at RR1, projecting further upside toward the next reachable target at $130,000, which acts as a Potential Reversal Zone (PRZ). The setup relies on clean confirmation: breakout, high volume on the weekly, and consolidation above resistance for sustained momentum.
📊 Key Highlights:
- Weekly V-pattern maturation can drive a strong bullish leg if confirmed above $119,430.
- Volume confirmation is vital: look for above-average weekly bars to validate breakout strength.
- Target zone sits at $130k, an area with clustering past liquidity and technical importance (PRZ).
- If the breakout stalls or is rejected, expect price to retest lower bands; first support now sits at $113,000–115,000.
🚨 Conclusion:
A bullish scenario is building, hinging on a weekly close with volume above $119,430. Such confirmation would validate a breakout from the V-pattern and set sights on $130k, where trend participants may look to realize or reassess positioning. Failure at this level could reload bids at key lower supports. Stay sharp for volume cues and structural follow-through.
Disclaimer
The information and publications are not meant to be, and do not constitute, financial, investment, trading, or other types of advice or recommendations supplied or endorsed by TradingView. Read more in the Terms of Use.
Disclaimer
The information and publications are not meant to be, and do not constitute, financial, investment, trading, or other types of advice or recommendations supplied or endorsed by TradingView. Read more in the Terms of Use.