Bitcoin’s monthly chart shows that price action has reached a critical zone after an extended bullish run from the 2023 lows.
50-Week Moving Average (MA50W)
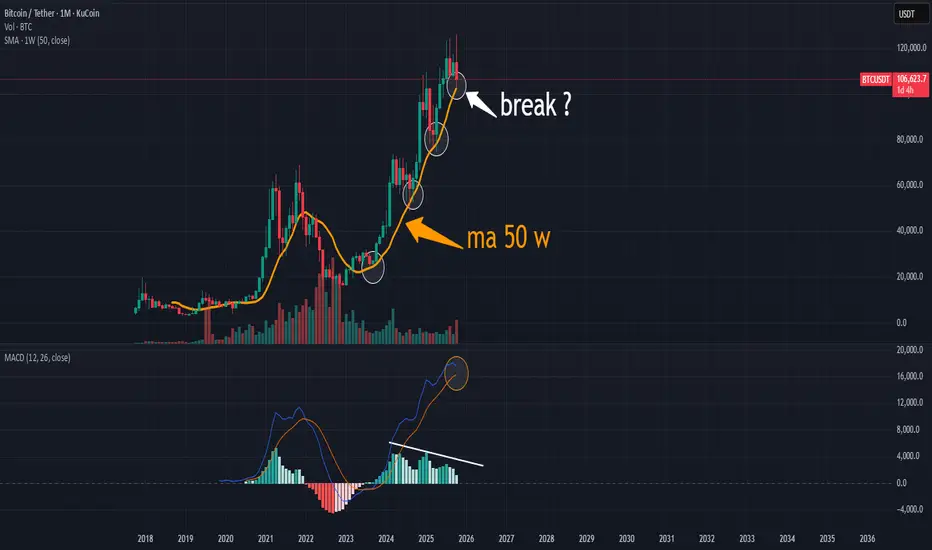
The 50-week moving average has acted as dynamic support throughout the current uptrend. Each touch in the past has led to a strong continuation move — but this time, price seems to be testing it again.
A confirmed monthly close below MA50W could signal a medium-term trend shift or a deeper correction
Monthly MACD – Bearish Divergence
The monthly MACD is showing bearish divergence: while price printed a higher high, the MACD histogram and signal line are turning lower.
This suggests waning bullish momentum and possible exhaustion of the current rally.
Key Levels
Support: 100K – 102K (aligned with MA50W)
Resistance: 125K – 130K
Outlook
A confirmed break below the MA50W could open the door for a correction toward the 90K–85K zone.
Conversely, if BTC holds above this level and bounces strongly, a new leg higher — potentially toward new all-time highs — could follow.
Conclusion
Bitcoin is at a make-or-break level.
The reaction around the 50-week moving average will likely define the market structure for the coming months. Traders should watch how the next few weekly and monthly candles close to confirm direction.
50-Week Moving Average (MA50W)
The 50-week moving average has acted as dynamic support throughout the current uptrend. Each touch in the past has led to a strong continuation move — but this time, price seems to be testing it again.
A confirmed monthly close below MA50W could signal a medium-term trend shift or a deeper correction
Monthly MACD – Bearish Divergence
The monthly MACD is showing bearish divergence: while price printed a higher high, the MACD histogram and signal line are turning lower.
This suggests waning bullish momentum and possible exhaustion of the current rally.
Key Levels
Support: 100K – 102K (aligned with MA50W)
Resistance: 125K – 130K
Outlook
A confirmed break below the MA50W could open the door for a correction toward the 90K–85K zone.
Conversely, if BTC holds above this level and bounces strongly, a new leg higher — potentially toward new all-time highs — could follow.
Conclusion
Bitcoin is at a make-or-break level.
The reaction around the 50-week moving average will likely define the market structure for the coming months. Traders should watch how the next few weekly and monthly candles close to confirm direction.
Trade active
Note
If weekly candles continue to close below $102K, that would confirm a technical breakdown — something not seen since the 2021–2022 cycle transition.
The RSI Divergence Indicator shows a clear series of bearish divergences throughout 2024–2025, where price made higher highs but RSI made lower highs.
Now RSI has dropped below the 50 midpoint, signaling loss of bullish momentum.
This is typically an early warning sign of trend weakness and potential medium-term correction.
Key Levels to Watch :
Immediate Support: $98,000 – $100,000 (current MA50W test zone)
Next Support: $90,000 – $92,000 (structural swing low + demand area)
Major Support: $85,000 (psychological + previous consolidation zone)
Resistance: $110,000 – $115,000 (previous local top and breakdown area)
Bearish scenario:
A confirmed weekly close below $100K could open the path toward the $90K–85K region, aligning with the macro support cluster and potential re-accumulation zone.
Bullish scenario:
If Bitcoin defends the MA50W and weekly RSI rebounds above 50, we could see renewed bullish momentum — possibly retesting the $120K level before year-end.
Disclaimer
The information and publications are not meant to be, and do not constitute, financial, investment, trading, or other types of advice or recommendations supplied or endorsed by TradingView. Read more in the Terms of Use.
Disclaimer
The information and publications are not meant to be, and do not constitute, financial, investment, trading, or other types of advice or recommendations supplied or endorsed by TradingView. Read more in the Terms of Use.